
How can you invest for value, raising your allocation to stocks when they are cheap and reducing it when they are expensive? This article uses extensive historical evidence to measure the value of stock markets and offers simple tactics to respond sensibly to under- and over-valuation.
A Portfolio's Value
When we invest, value competes with emotion. Too often, emotion wins. We buy in elation, sell in despair. Were it not so, were value to carry the day, we would all buy when markets are undervalued (prices are cheap) and sell when they are overvalued (prices are expensive). Alas, we can't all get in at the bottom and out at the top. Then markets wouldn't be markets. They would be boring places where all prices are fair; every deal, equitable; no transaction, regretted.
We can, however, adopt tactics that tilt the contest toward value and raise shields against emotion. The tactics aren't perfect. But they are based on solid historical data, and, with patience, they can work. Three of them are the subjects of this article:
We can, however, adopt tactics that tilt the contest toward value and raise shields against emotion. The tactics aren't perfect. But they are based on solid historical data, and, with patience, they can work. Three of them are the subjects of this article:
- Be aware. Know when stocks are relatively over-, under-, or fairly-valued.
- Adjust sensibly. Set your financial plans according to the current value of stocks and your time-horizon.
- Play the odds. Focus on long-term trends that are in your favor, not on short-term, all-in bets.
Knowing Current Value
Throughout 2014 and 2015, articles and commentators in the financial media noted that U.S. stocks were over-valued (priced too high) by many standards. One of the most common standards is Shiller's CAPE (cyclically adjusted price-earnings), also known as PE10 because it averages the price-earnings ratio of the Standard & Poor's 500 over the past 10 years.
Shiller's data reports the S&P 500 (or a reasonable surrogate) and consumer-price inflation for every month since 1871, along with 10-year PE or CAPE starting 10 years later, in 1881. Over that period, the median (middle) value of CAPE was 16. The value in 2014 and 2015 was around 26, a level that ranks in the top 7% of stock-prices since 1881. Sounds expensive!
Does a value that high mean stock prices will fall, and if so, when? And might it be a swift plunge or a long, slow, grinding deceleration? When using historical data to answer such questions, two caveats are important:
- History will show a range of past outcomes, not a precise, deterministic solution.
- The future may (probably will) differ from the past in ways we cannot foretell.
Predicting Next Year
Here's a chart that shows how CAPE has related to stock-prices one year into the future. The chart has 1596 data-points, one for the 12-month gain after every month from January 1881 to December 2013. The horizontal axis, marked with the admittedly geeky label "LN( CAPE/16)" is a log scale, following Angelini et al. Using a log scale increases the correlation (predictability) between CAPE and future stock-prices. Taking the log on CAPE divided by its median of 16 means that half the data points are to the left of zero, and half to the right. The key point is this: Late in 2015, with CAPE near 26, the U.S. stock market was near 0.500 on the scale.
Here's a chart that shows how CAPE has related to stock-prices one year into the future. The chart has 1596 data-points, one for the 12-month gain after every month from January 1881 to December 2013. The horizontal axis, marked with the admittedly geeky label "LN( CAPE/16)" is a log scale, following Angelini et al. Using a log scale increases the correlation (predictability) between CAPE and future stock-prices. Taking the log on CAPE divided by its median of 16 means that half the data points are to the left of zero, and half to the right. The key point is this: Late in 2015, with CAPE near 26, the U.S. stock market was near 0.500 on the scale.
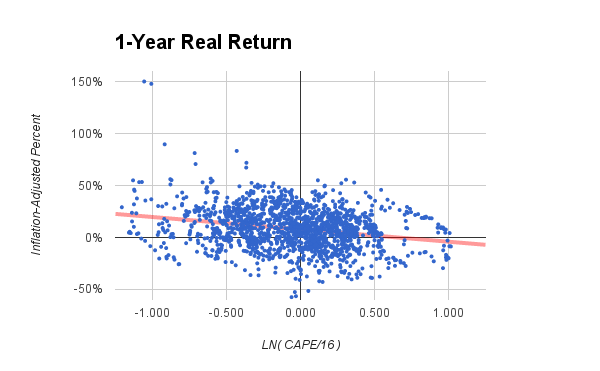
In the chart, the left (vertical) axis shows the one-year gain in the S&P 500, after adjusting for inflation. On average, since the late 19th century, the annual return would have been 6% or more, depending on the range of dates included. The red line in the chart is the best-fitting straight line for these data-points. Looking at 2015's CAPE (near 0.500 in the chart), the red line would predict a one-year gain close to 0%, inflation-adjusted. Thus, statistically, the best prediction in late 2015 was that U.S. stock-prices might stay level with inflation in 2016, but not do much better. With most forecasters predicting U.S. inflation to be about 2%, that would also be the expected return of U.S. stocks.
How credible is that prediction? Not very. Look at all the points around the 0.500 level. Some years in the past were a lot better than 0% inflation-adjusted, and some, a lot worse. Statistically, the red line explains only 11% of the overall variation, according to Andrew Ang's fine textbook, Asset Management (chapter 8, Table 8.7). It's better than nothing, but not much.
If there's an 11% chance of rain today, would you take an umbrella? Maybe. Would you wear your heavy-duty rain-slicker and knee-high rubber boots? No. By analogy, you might want to reduce your U.S. stock holdings somewhat, or accept some risk of a down-draft or a disappointment in the months ahead. But you won't bail out of stocks totally and irrevocably.
Predicting the Next 15 Years
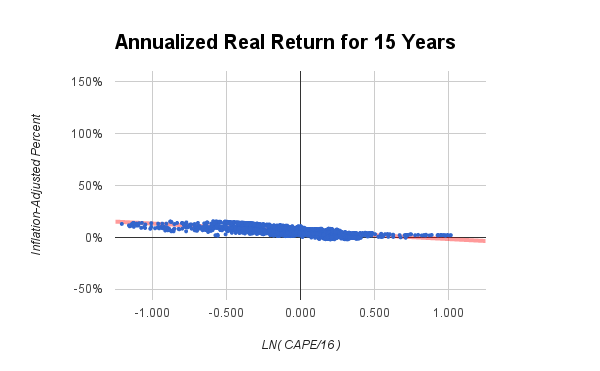
If CAPE is weak for predicting next year, how about the longer term, say, 15 years? Look at the next chart. It's exactly like the previous chart, except for one change. The data-points show the compound annual returns for the next 15 years, not the next one year. The results differ in two important ways:
If CAPE is weak for predicting next year, how about the longer term, say, 15 years? Look at the next chart. It's exactly like the previous chart, except for one change. The data-points show the compound annual returns for the next 15 years, not the next one year. The results differ in two important ways:
- The prediction is much more accurate, explaining much more of the variance, with the data-points clustered more tightly around the best-fitting line.
- The effect of CAPE is weaker in magnitude. You can see this by comparing the slope (tilt) of the lines in the two charts. The slope is shallower over 15 years, meaning that as CAPE rises or falls, the corresponding change in stock-prices is less. That's hardly surprising. Who would expect today's CAPE to have a huge effect on stock-prices every year for 15 years? Over time, the effect will surely tend to diminish, as stocks respond to today's news, not the news from a decade ago.
Is today's CAPE meaningful for stock-prices 15 years from now? For example, if you are planning to retire in 15 years, or your child will be starting college then, should today's CAPE have any bearing on your investments? To show the answer, here's a chart that zooms into the relevant portion of the 15-year chart, near the late-2015 value of CAPE.
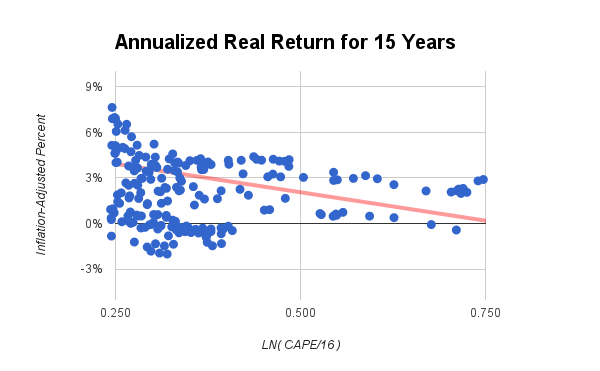
The key point in this chart is that, at the late-2015 value of CAPE, historical 15-year returns have been around 0% to 4%, inflation-adjusted. That's similar to the long-term historical returns of 10-year U.S. treasuries, which have bested inflation by 2.5% since 1871. It's above inflation or, worst-case, quite close to inflation, but it's not the 6% inflation-adjusted returns that U.S. stocks generated when CAPE had more moderate values.
Adjusting Your Financial Plans
Were this article written in early 2009 or, even better, in mid-1982, the CAPE value would have been low enough to imply strong returns for U.S. stocks over the next 15 years. But by late 2015, the 1982 forecast had ended long ago, and the 2009 forecast had already seen more than half its duration and perhaps more than half its gains. With the 15-year outlook less sanguine starting in 2016, how would a savvy investor adjust?
The short answer is to make sensible adjustments, given what's possible. To understand what that means, consider an analogy to travel plans. Suppose you plan to take a summer vacation next year. What are your sensible options to make it a high-value, low-cost vacation? If you were retired, you might consider reducing the expense by vacationing in February, when airfares are cheap, rather than July, when they are dear. On the other hand, if you have children in school, and July is your only option, you might opt to plan long in advance, buy your air-tickets 12 months before the date you expect to travel, and hope to snag some bargain fares.
In short, your sensible options depend on your circumstances. Below are some basic choices. Note that these are prudent adjustments in your strategy, not sharp reversals in direction. They are statistical probabilities, not all-in speculations.
- Be aware. Know whether U.S. stocks are currently over-, under-, or fairly-valued. The able2pay.com calculators provide that information by showing two values: normal and value-adjusted. The value-adjusted numbers are based on the historical data illustrated in the charts above. If U.S. stocks are over-valued (expensive), the value-adjusted number for stocks is lower than the normal value. If U.S. stocks are under-valued (cheap by historical norms), the numbers reverse.
- Tilt your allocations. When the value-adjusted number is lower than normal (as in mid-2016), invest less than normal in stocks and more in bonds. When the value-adjusted number is higher than normal (as in early 2009), do the reverse; invest more than normal in stocks, less in bonds. (The next section amplifies these suggestions.)
- Plan for the right period. If your time-horizon is around 5-20 years, and the value-adjusted number is lower than normal (as in late 2015), plan to invest more each year to reach your financial goals, as your returns may be weaker than normal. For shorter time-periods (under 5 years), realize that predictions are inaccurate, and, if that makes you nervous, tilt your strategy toward lower volatility and less risk of loss.
Odds in Your Favor
As a metric for investors, CAPE is useful but not conclusive. Where it predicts the biggest effects (in the near term), its accuracy is weakest; where its predictions are more accurate (over many years), the magnitude of the effect is diminished. It's a conundrum, but not without value. Fallible as it is, CAPE remains one of the best predictors we have. Ang's textook makes the point by reviewing academic research on 14 possible predictors over various periods of time. CAPE was the only one of the 14 that generated statistically reliable forecasts (see chapter 8, Table 8.7). CAPE's explanation of market variance increased from a paltry but reliable 3% at one calendar quarter to 11%, 17%, and 23% at one, two, and five years. No other predictor came close to that level of prowess, middling though it may be.
For retail investors, the message is clear. It's wise to play the long-term odds of overall market value and nothing else. Perhaps there are ways for some savvy professionals to do better, but they will make it a full-time occupation with copious resources at their command. For us ordinary mortals, it's best to stick to trends where the odds are modestly favorable, if given enough time to become profitable.
Good Odds
The following trends may offer favorable odds, over a period of several years:
Dubious Odds
For contrast, here are additional ideas that might tempt you. While they might occasionally work, these ideas have less favorable odds, on historical or logical grounds.
For retail investors, the message is clear. It's wise to play the long-term odds of overall market value and nothing else. Perhaps there are ways for some savvy professionals to do better, but they will make it a full-time occupation with copious resources at their command. For us ordinary mortals, it's best to stick to trends where the odds are modestly favorable, if given enough time to become profitable.
Good Odds
The following trends may offer favorable odds, over a period of several years:
- If U.S. stocks are over-valued, invest less in U.S. stocks, shifting the difference to intermediate or long-term U.S. Treasury bonds. When stocks falter, U.S. Treasuries, which tend to have mildly negative correlations with stocks, may go the other way. Even if they don't, they are likely to reduce your portfolio's volatility.
- Additionally, when U.S. stocks are over-valued, consider shifting some of your holdings in U.S. stock funds to diversified U.S. and international low-volatility stock funds, provided they have low fees. Examples are VMVFX from Vanguard or ACWV from iShares. For more on the rationale of such funds, our article on Factor Investing.
- If U.S. stocks are under-valued, invest less in U.S. Treasuries, shifting the difference to U.S. stocks. If your portfolio has no corporate bonds, you might also consider placing about half your bond-allocation in corporate bonds and the other half in Treasuries. The factors that favor a recovery in stock prices may increase the return of corporate bonds as well.
Dubious Odds
For contrast, here are additional ideas that might tempt you. While they might occasionally work, these ideas have less favorable odds, on historical or logical grounds.
- Does it make sense to apply CAPE internationally by searching for countries with below-average values of the metric and investing there? Perhaps not, for several reasons. First, to work at all, this strategy would most likely require finding many low-CAPE countries and holding them for many years. That's because the predictive power of CAPE is middling, not perfect, and with most countries having stock markets much smaller and less diverse than the U.S., you would have to buy many of them to assure that your portfolio is not over-concentrated in certain industries, regions, or currencies. Second, and quite important, good data on CAPE histories in foreign countries is hard to find. That said, if you really want to go down this road, one source of solid information and sage advice might be Star Capital, a globally oriented firm in Germany.
- You might get a sense of decisiveness by making a big switch between stocks and bonds, even when the CAPE-adjustment is small. Perhaps you would be inclined to change from 65% stocks to 0% when the calculator generates a smaller adjustment to, say, 60%. But have a look, again, at the charts above, and remember that the relation between stock-valuation (as roughly measured by CAPE) and stock-returns (in the past, which won't perfectly match the future) is a statistical approximation (not anywhere near perfect). All those hedges in parentheses are reasons not to make a big bet. If CAPE values should ever drift to historical extremes, the adjustment shown by the calculator would be quite large: not a total switch, but definitely big enough to satisfy any urge to take action. Don't jump the gun.
- In a similar vein, there's little justification for switching radically between U.S. and international stocks. If U.S. stocks are over- or under-valued, large non-U.S. markets like Japan, the United Kingdom, France, and Germany might be the opposite. Or the same. Or a mixed bag. You would have to check and then act accordingly, with a firm resolve to wait a few years to see if your bet pays off. A simpler and more prudent tactic is #2 under "Good Odds," which would simultaneously manage your portfolio's volatility and adjust its geographic composition.
Disclaimer: Historical data cannot guarantee future results. Although a mixture of bonds, stocks, and other investments may be safer than investing exclusively in one class of assets, diversification cannot guarantee a positive return. Losses are always possible with any investment strategy. Nothing here is intended as an endorsement, offer, or solicitation for any particular investment, security, firm, or type of insurance. You are responsible for your own investment decisions. Please read our full disclosures and Fiduciary Oath.