
Suppose, as an investor, your goal is to craft the portfolio that, among all possible options, has the lowest risk of potential drawdowns. You might appreciate that any portfolio can suffer losses, even normally safe Treasury Notes. After all, during times like the world wars and Great Depression of the twentieth century, and in the recent aftermath of the 2008-2009 recession, Treasury departments (not to mention stingy banks) have been known to pay interest below the inflation rate. In doing so, they can inflict hidden losses that diminish your buying power, while pretending to offer positive returns.
Still, for short term expenses to be paid within a year or two, Treasury Bills, money market funds, and bank savings accounts are the best choice. They may not be optimal, however, if you have a longer horizon for spending down your assets. Relevant scenarios might include a reserve or emergency fund, a health savings account, or a portfolio in which you are accumulating assets for a major purchase, such as the downpayment on a future home.
Still, for short term expenses to be paid within a year or two, Treasury Bills, money market funds, and bank savings accounts are the best choice. They may not be optimal, however, if you have a longer horizon for spending down your assets. Relevant scenarios might include a reserve or emergency fund, a health savings account, or a portfolio in which you are accumulating assets for a major purchase, such as the downpayment on a future home.
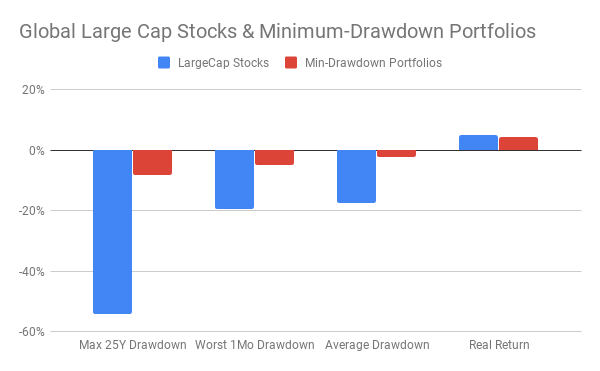
For these purposes, where the spending dates are indefinite or a few years away, an ideal portfolio would generate minimal drawdowns while offering a reasonable potential for assets to grow. What are the best ways to construct such a portfolio? The historical results of some good options are summarized in the chart above. It compares large-cap stocks to the average of several low-drawdown portfolios. The data for the chart cover various countries, time periods, and methods of asset-management. All the methods that are averaged together in the chart drastically reduced drawdowns. Some of them achieved returns rivaling those of large-cap stocks. The effort they might require from you to manage your funds would range from virtually none to a modest, once-monthly review. This post reveals the details behind the average results in the chart, explaining how low-drawdown portfolios can be built and how they have performed historically.
Portfolio Options
To analyze the historical data, I designed portfolios to simulate risk-averse investors who chose to do one of the following:
Best Options
The chart below shows drawdown metrics for multiple portfolios, across a variety of countries and time-periods. Although the data and results are multi-faceted, the main message is quite simple. Compared to an all-stocks portfolio, several excellent portfolios reduced drawdowns significantly, all of them by nearly the same amount, over the historical spans of this analysis.
Portfolio Options
To analyze the historical data, I designed portfolios to simulate risk-averse investors who chose to do one of the following:
- Invest entirely in Treasuries. As in my other posts, constant maturity,10-year Treasuries were used for this purpose. They correspond closely to mutual funds and ETF's that hold intermediate-term government securities. Except for periods when government policies or unusual financial conditions force interest rates to fall below the current inflation rate, 10-year Treasuries should be quite safe. Investing in them is the default choice, the benchmark against which all other low-drawdown portfolios are measured.
- Combine 10-year Treasuries with large-cap stocks. The rationale for this option was that diversifying a portfolio to include a small to moderate portion of equities should strengthen it. Treasuries and stocks tend to have a slightly negative correlation. In times when Treasuries fall in value, stocks may rise, on average. The key question is how much to invest in stocks to get just the right amount of compensation for the occasional weakness of Treasuries.
- Combine 10-year Treasuries with low-volatility stocks. When one's goal is to limit the drawdowns in a portfolio containing some equities, it would seem reasonable to favor the stocks that are least inclined to fall when the overall market plunges. This option is new, as mutual funds and ETFs for low-volatility stocks have become available only very recently. For most such funds, the available history is meager. Fortunately, one excellent set of data has worldwide low-volatility indexes with 25 years of history, just enough to match the 25-year periods analyzed throughout the series of posts that began here on June 3, 2019. (For specifics, see the section below titled "Some Technical Details.")
- Rebalancing. Set a target for the percentage of stocks to be held. Monitor the portfolio monthly, and, if it has drifted 5% or more from the target, exchange assets to restore the balance. For example, if the target is 15% but the current level has risen to 20% or fallen to 10%, restore the portfolio's funds to the 15% target.
- Rotation. Set a ceiling for the percentage of stocks held in the portfolio during times when, compared to Treasuries, stocks have been performing well. Also set a floor for the percentage of stocks to be held when stocks have been performing worse than Treasuries. Once a month, compare the total return of stocks and that of Treasuries, over a window of a few months, and respond accordingly. For example, suppose that the ceiling were 80% and the floor 20%; that this month's review showed Treasuries to be doing better than stocks; and that last month's review showed the opposite. Then you would exchange funds to move from last month's ceiling of 80% stocks to this month's floor of 20%. In general, each monthly review would dictate one of three actions:
- Exchange funds to match the desired floor or ceiling value, if the recent total returns of stocks and Treasuries indicate a switch, or ...
- Rebalance to maintain the current allocations, give or take 5%, or ...
- Do nothing if this month's better-performing asset is the same as last month's, and the portfolio's allocations are within 5% of the intended values.
Best Options
The chart below shows drawdown metrics for multiple portfolios, across a variety of countries and time-periods. Although the data and results are multi-faceted, the main message is quite simple. Compared to an all-stocks portfolio, several excellent portfolios reduced drawdowns significantly, all of them by nearly the same amount, over the historical spans of this analysis.
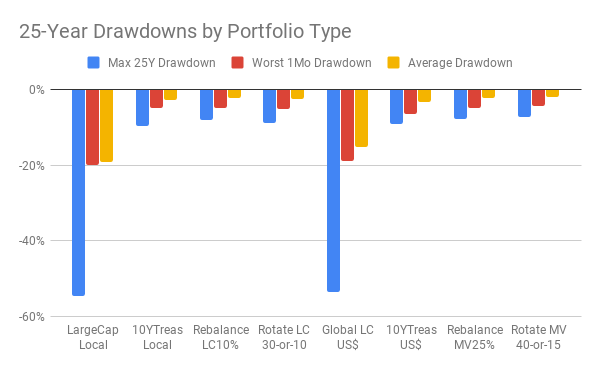
The left half of the chart aggregates the same data-sets as in my other recent posts: large-cap stocks and 10-year Treasuries across four 25-year periods for the U.S. since 1919, in dollars, and the most recent 25-year period for Germany, Japan, and Australia, in their local currencies. The right half adds the most recent 25-year period for a global stock index (in dollars); the same period for US 10-year Treasuries; and the average over that time of three low-volatility indexes, one for the U.S., another for developed countries outside the U.S., and the last for worldwide stocks including the U.S. (See "Some Technical Details" below.)
Both sides of the chart show drawdowns measured three ways: the maximum cumulative decline within a 25-year period, the worst single month in that period, and the average accumulated loss for all months when the portfolio's value was falling.
As would be expected, portfolios invested 100% in stocks had big drawdowns, despite achieving good cumulative returns in the long run. Their maximum drawdowns in 25 years averaged -55%. Their worst-month drawdowns and their average on-going drawdowns were between -15% and -20%.
On all these measures, the low-drawdown portfolios excelled. Their maximum cumulative loss during a 25-year period was consistently better than -10%; the worst-month drawdown was, on average, between -4% to -6%; and the average on-going loss during periods of decline was -2% to -3%.
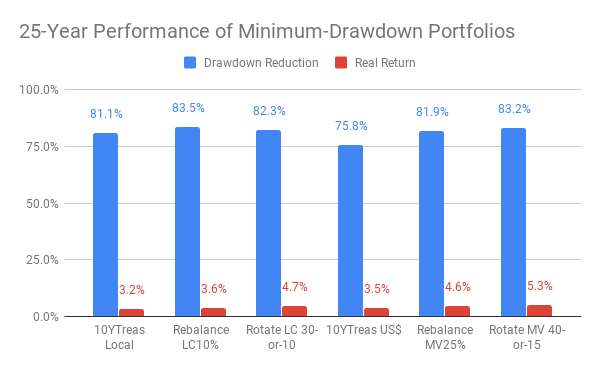
The next chart shows additional measurements for the best portfolios:
Both sides of the chart show drawdowns measured three ways: the maximum cumulative decline within a 25-year period, the worst single month in that period, and the average accumulated loss for all months when the portfolio's value was falling.
As would be expected, portfolios invested 100% in stocks had big drawdowns, despite achieving good cumulative returns in the long run. Their maximum drawdowns in 25 years averaged -55%. Their worst-month drawdowns and their average on-going drawdowns were between -15% and -20%.
On all these measures, the low-drawdown portfolios excelled. Their maximum cumulative loss during a 25-year period was consistently better than -10%; the worst-month drawdown was, on average, between -4% to -6%; and the average on-going loss during periods of decline was -2% to -3%.
The next chart shows additional measurements for the best portfolios:
- Drawdown Reduction: This value is the percentage by which a portfolio avoided the losses of an all-stocks portfolio for the same country or region and the same 25-year period.
- Real Return: This metric for a portfolio's performance included reinvestment of dividends and interest, and was adjusted for local inflation over the relevant time-period.
Let's examine these portfolios one by one:
Key Takeaways
If your primary goal is to limit drawdowns on investments to be spent more than a year or two in the future, several good options are available. The choice between them may depend on how much effort you are willing to put into monitoring and managing your portfolio.
- 10YTreas Local. Results summarized in the two left-most bars in the chart came from investing 100% in 10-year Treasuries, both from 1919 to 2019 in the U.S. and from 1994 to 2019 in Germany, Japan, and Australia, always in local curriences. The maximum, worst-month, and average drawdowns of these all-bond portfolios were, on average, 81% better than investing locally in large-cap stocks. The total returns were 3.2% above local inflation. A comparable all-stocks portfolio, with its large drawdowns, would have had better returns, but not hugely so (4.9%, not shown in the chart).
- Rebalance LC 10%. Portfolios under this heading rebalanced 10% in local large-cap stocks and 90% in local 10-year Treasuries, over the same countries and time-periods. The reduction of drawdowns was slightly better than all-Treasuries (83% vs. 81%), as was the real return (3.6% vs. 3.2%). Results nearly as good would have accrued if the rebalanced allocation to stocks had been 15%. In short, with rebalancing as the strategy, a modest allocation to local large-cap stocks had slightly less risk and better returns than investing entirely in local 10-year Treasuries.
- Rotate LC 30-or-10. Across a comprehensive set of rotation strategies, the best performance for the same countries and 25-year periods resulted from swapping between a ceiling of 30% and a floor of 0% in local large-cap stocks. Over time, this strategy averaged about 19% in stocks and 81% in local Treasuries (with the time in stocks occurring only when they had done better than Treasuries over a recent three-month window). This portfolio, too, outperformed the all-Treasuries benchmark, reducing drawdowns comparably (82% vs. 81%) and achieving better real-returns by a good margin (4.7% vs. 3.2%).
- 10YTreas US$. To evaluate low-volatility ETFs from 1994 to 2019, the analysis emulated the behavior of an investor in the U.S. In effect, the analysis used dollars to purchase U.S. and international low-volatility ETFs, and compared the results to investing dollars either in U.S. Treasury bonds or in a worldwide index of stocks in all developed countries including the U.S. As shown in the chart above, a portfolio of 10-year U.S. Treasuries held for 25 years, starting in 1994, reduced drawdowns by 77%, compared to investing entirely in worldwide stocks for the same period. While the return of the all-equity index exceeded U.S. inflation (5.2%, not shown in the chart), the U.S. Treasury benchmark also did well (3.5% above U.S. inflation).
- Rebalance MV 25%. When applied to minimum-volatility indexes for large-cap and mid-cap stocks, the rebalancing strategy that generated the smallest drawdowns had an allocation of 25%. That's notably higher than the allocation of 10% that best reduced drawdowns for all large-cap stocks. Rebalancing to 25% for minimum volatility reduced drawdowns more than investing in benchmark U.S. Treasuries (82% vs. 77%). It also generated better real returns (4.6% vs. 3.5%).
- Rotate MV 40-or-15. For the rotation strategy, the combination of floor and ceiling values that best limited drawdowns was 40% at the ceiling and 15% at the floor. Over the most recent 25 years, drawdowns were reduced 84% by the strategy of swapping between 40% and 15% in minimum volatility indexes while investing the remainder in U.S. Treasuries. Real returns were the best of all methods (5.3%), much better than the benchmark for Treasuries (3.5%) and on par with buying and holding all stocks in the worldwide index (5.2%, not shown in the chart).
Key Takeaways
If your primary goal is to limit drawdowns on investments to be spent more than a year or two in the future, several good options are available. The choice between them may depend on how much effort you are willing to put into monitoring and managing your portfolio.
- As a hands-off, low-effort method, investing entirely in local, intermediate-term government securities, comparable to 10-year Treasuries, is certainly a good choice. It is likely to generate better returns than bank deposits or money-market funds, to stay ahead of inflation in most periods, and to suffer drawdowns only temporarily and modestly. That said, this strategy is not completely risk-free. The cautionary counterexample is 1944 to 1969 in the U.S., when 10-year Treasuries fell behind inflation by -0.7% per year, resulting in a cumulative 16% loss in buying power over the 25-year period.
- Rebalancing requires a bit of work. If done with a low allocation to stocks, around 10% to 15%, it can be safer than the all-Treasuries method, and it may generate modestly better returns. It certainly seems worth the effort (and possibly worth the expense, if you get your investment firm to do the work).
- Rotation, like rebalancing, will require you to monitor your portfolio every month. The necessary effort is probably not much more than doing your own rebalancing. To limit drawdowns, the best settings for the rotation strategy were competitive with Treasuries and with rebalancing. Significantly, rotation bested all other strategies on real returns. (For more examples, see Rotating Out of Harm's Way and Does Rotation Work in Global Markets.)
- Low-volatility funds seem particularly well-suited for portfolios whose goal is to minimize drawdowns. Had you opted for rebalancing, you would have had better returns at no additional risk by targeting 25% in minimum-volatilty stocks than by maintaining 10% or 15% in large-cap stocks. A similar advantage for minimum volatility stocks also held, over the most recent quarter century, for the rotation strategy.
Some Technical Details
Information about technical details in an earlier post in this series apply to the findings reported here. Additional details follow.
Information about technical details in an earlier post in this series apply to the findings reported here. Additional details follow.
- Only monthly data was available for some of the countries and time-periods in this analysis. For monthly rebalancing, a threshhold of 5% works well. Had weekly data been available, the preferred method would have been to check weekly and rebalance if the drift surpasses 3%. See my article on rebalancing for a comprehensive analysis.
- In the results reported here, the window for rotation was three months, unless specifically stated otherwise. However, in findings not displayed here, windows from two to six months often performed similarly in the long run. For some purposes, longer windows up to one year may be advisable for some investors, e.g., to limit churn that might have tax-consequences.
- The low-volatility indexes were from MSCI, for the period from April 1994 to March 2019. These indexes underlie three ETF's offered by iShares: USMV for medium-to-large U.S. companies, EFAV for medium-to-large companies in developed countries outside the U.S., and ACWV for companies in both developed and developing nations worldwide. Although the underlying indexes have a quarter-century of data, the ETF's have traded publicly for far less time. Were you to consider only the shorter trading history of the ETFs, you might conclude that buying and holding low-volatility ETFs at a high percentage of your portfolio would be a very safe strategy, even better than holding all-Treasuries. However, the trading history includes no major collapse in stock prices, such as the dot-com bust of 2000-2003 and the deep recession of 2008-2009. During those periods, the indexes had substantial drawdowns, averaging -40%. Using the 25-year index history, instead of the shorter ETF history, captured drawdown risks of this magnitude.
- Drawdown metrics were calculated as follows:
- Maximum Drawdown: For each month in a 25-year period when the portfolio's value is lower than it's previous peak in the period, calculate the percentage loss. Over the entire 25 years, calculate the maximum of this monthly value.
- Worst 1-Month Drawdown: For each month in a 25-year period, calculate the percentage change in the portfolio's value compared to the previous month. Find the minimum of these values.
- Average Drawdown: For each month in a 25-year period, calculate the percentage change in the portfolio's value compared to the previous month. For all months in which this value is negative, calculate the average.
- Drawdown Reduction: For a 25-year period, find the Maximum Drawdown, Worst 1-Month Drawdown, and Average Drawdown values for a portfolio invested entirely in a reference set of stocks, designated as m(s), w(s), and a(s), respectively. Find the same values for a comparison portfolio, designated as m(c), w(s), and a(c), respectively. Then calculate the average of 1 - m(c)/m(s), 1 - w(c)/w(s), and 1-a(c)/a(s).

 RSS Feed