
This article shows how to build a basic portfolio of a few funds from the best companies. The portfolio may work especially well in retirement and college savings accounts; examples are also given for taxable accounts. The steps are simple:
- Answer two key questions about your goals and timeline.
- Select a few funds that are typically available from any investment firm.
- Review what the best firms offer.
- Understand how your portfolio may perform over time.
Your Goals & Timeline
Answer two simple questions about your goals and timeline. These will establish target percentages for stocks and bonds.
When do you expect to spend most or all of the investments in this account?
When do you expect to spend most or all of the investments in this account?
- All in the next year or two: Set your final target = 0% and stop (skip the next question).
- Most or all within five years: Set your preliminary target = 30% and continue.
- Six or more years from now: Set you preliminary target = 60% and continue.
- Maximize gains: Add 15% to your target.
- Minimize losses: Subtract 15% from your target.
- Do both: Keep your preliminary target (no change).
Funds for Your Portfolio
For ease of reference, let's use the following names for the target portfolios:
- Now-0. The percentage of stocks is zero, and the savings are likely to be spent within a year or two.
- Now-15. Stock funds are 15% of the portfolio, and most or all of the money will be spent within five years.
- Soon-30. Most or all of the money may be spent within five years, but stocks get a bigger share, 30% of the portfolio.
- Soon-45. Much of the money may be spent in five years or somewhat more, and 45% is invested in stocks.
- Later-60. Spending will occur in the future, and the portfolio has a moderate allocation of 60% in stocks.
- Later-75. Spending is deferred to the future, perhaps many years away, and stocks are 75% of the portfolio.
| Target | US Stocks | International Stocks | Intermediate Bonds | Short-Term Bonds |
|---|---|---|---|---|
| Later-75 | 50 % | 25 % | 25 % | 0 % |
| Later-60 | 40 % | 20 % | 40 % | 0 % |
| Soon-45 | 30 % | 15 % | 55 % | 0 % |
| Soon-30 | 30 % | 0 % | 40 % | 30 % |
| Now-15 | 15 % | 0 % | 25 % | 60 % |
| Now-0 | 0 % | 0 % | 0 % | 100 % |
Funds for Most Accounts
Here are generic descriptions of the funds that work for most accounts, along with examples for a few good firms: Betterment, Fidelity, TIAA, and Vanguard. For more information about these and other firms, see our article Best Firms 2016.
U.S. Stocks: Use an index fund that invests in the total U.S. stock market. If that's not available, use an index fund of large-cap U.S. stocks or the S&P 500. Avoid anything that's not indexed, is more specific, or has fees over 0.5%. Examples:
International Stocks: Use an index fund that invests in all non-U.S. stock markets. If it's not available, use an index fund of EAFE stocks (developed countries outside the U.S.). Avoid anything that's not indexed, is more specific, or has fees over 0.5%. Examples:
Intermediate Bonds: Use a bond fund that invests primarily in a broad mix of U.S. treasury and corporate bonds. Avoid funds with a limited focus on TIPS or on inflation-linked, international, high-yield, or short-term bonds; or with fees over 0.35%. Examples:
Short-Term Bonds: Use a fund of U.S. treasury bonds with maturities less than five years. If such a fund is not available, use instead a short-term bond index fund or a money-market fund. Avoid funds with fees over 0.3%. Examples:
More Options for IRAs and Taxable Accounts
For an IRA or taxable account, some additional options are available. You are unlikely to find them, however, in a 401(k) or 403(b) retirement plan or a 529 college savings plan.
Funds for Most Accounts
Here are generic descriptions of the funds that work for most accounts, along with examples for a few good firms: Betterment, Fidelity, TIAA, and Vanguard. For more information about these and other firms, see our article Best Firms 2016.
U.S. Stocks: Use an index fund that invests in the total U.S. stock market. If that's not available, use an index fund of large-cap U.S. stocks or the S&P 500. Avoid anything that's not indexed, is more specific, or has fees over 0.5%. Examples:
- Vanguard: Total Stock Market Index
- TIAA-CREF: Equity Index Fund. Prefer the TIAA-CREF mutual fund, if available, not the similarly named CREF annuity.
- Fidelity: Spartan Total Market Index
- Betterment: automatically selects appropriate index funds
International Stocks: Use an index fund that invests in all non-U.S. stock markets. If it's not available, use an index fund of EAFE stocks (developed countries outside the U.S.). Avoid anything that's not indexed, is more specific, or has fees over 0.5%. Examples:
- Vanguard: Total International Stock Index
- TIAA-CREF: Enhanced International Equity Index. If not available, CREF Global Equities is an alternative.
- Fidelity: Spartan Global ex-U.S. Index
- Betterment: automatically selects appropriate index funds
Intermediate Bonds: Use a bond fund that invests primarily in a broad mix of U.S. treasury and corporate bonds. Avoid funds with a limited focus on TIPS or on inflation-linked, international, high-yield, or short-term bonds; or with fees over 0.35%. Examples:
- Vanguard: Intermediate Term Bond Index. Or consider Intermediate Term Tax-Exempt or a state-specific municipal bond fund for a taxable account. If you have more than 40% in bonds, consider Total International Bond Index for about a quarter of your bond investments; it investments in bonds from solid, non-U.S. governments, hedged against currency values.
- TIAA-CREF: Bond Plus Fund. If not available, CREF Bond Fund is an alternative.
- Fidelity: Spartan U.S. Bond Index. Or consider Intermediate Municipal Income or a state-specific fund for a taxable account.
- Betterment: automatically selects appropriate index funds
Short-Term Bonds: Use a fund of U.S. treasury bonds with maturities less than five years. If such a fund is not available, use instead a short-term bond index fund or a money-market fund. Avoid funds with fees over 0.3%. Examples:
- Vanguard: Short Term Federal or Short Term Treasury. Or consider Limited Term Tax-Exempt for a taxable account.
- TIAA-CREF: Short-Term Bond Fund. Avoid a guaranteed interest fund, if it restricts withdrawals.
- Fidelity: Spartan Short-Term Treasury Bond Index. Or consider Limited Term Municipal Income for a taxable account.
- Betterment: automatically includes relevant funds
More Options for IRAs and Taxable Accounts
For an IRA or taxable account, some additional options are available. You are unlikely to find them, however, in a 401(k) or 403(b) retirement plan or a 529 college savings plan.
- Invest at Betterment, and simply use the target percentage for stocks. Betterment's automated service goes beyond the basics in three ways: capturing value, rebalancing funds in an optimal manner, and automatically limiting taxable transactions.
- Invest at Vanguard, using the alternate table below and these funds: Global Minimum Volatility; either Mid-Cap Value Index or Strategic Equity; Intermediate-Term Bond Index; and Short-Term Treasury. For a taxable account, select the bond funds mentioned above.
- Invest in a low-cost brokerage account at a firm such as Fidelity or TD Ameritrade, using the alternate table below and the following ETFs: iShares MSCI All-Country World Minimum Volatility (ACWV), Vanguard Mid-Cap Value (VOE) or equivalent; Vanguard Intermediate-Term Bond (BIV) or equivalent; Vanguard Short-Term Government Bond (VGSH) or equivalent. For a taxable account, consider iShares National AMT-Free Muni Bond (MUB) for the intermediate-term bonds.
| Target | Global Low Volatility | Mid & Small Value | Intermediate Bonds | Short-Term Treasury |
|---|---|---|---|---|
| Later-75 | 50 % | 25 % | 25 % | 0 % |
| Later-60 | 40 % | 20 % | 40 % | 0 % |
| Soon-45 | 30 % | 15 % | 55 % | 0 % |
| Soon-30 | 30 % | 0 % | 40 % | 30 % |
| Now-15 | 15 % | 0 % | 25 % | 60 % |
| Now-0 | 0 % | 0 % | 0 % | 100 % |
To learn the rationale for global low-volatility stocks, mid-to-small value-stocks, and Betterment's portfolio, see the articles Diversify! and Factor Investing on the Portfolios menu.
What the Best Firms Offer
The table below summarizes firms and types of accounts that able2pay.com considers to be low-cost and high-quality. A firm may have good products across the board, or it may be strong only in some areas, or it may offer a mix of low-cost and high-cost funds. The table is written for someone who seeks low fees, prefers basic portfolios, and is willing to do only a limited amount of account-management. Entries in the table might look different, were they written for investors who prefer to be active or to hold extensive portfolios. To find additional information about particular firms, use the search bar on our News tab.
| Firm | 401(k) & 403(b) | IRA | 529 College Savings | Taxable |
|---|---|---|---|---|
| Betterment | 401(k) product newly offered in 2016. | Excellent. Turnkey, fully automated solution with a smart portfolio. | Not offered. | Excellent. Turnkey, fully automated solution with a smart portfolio. |
| Fidelity | Good. Low-fee index funds may or may not be available. | Good. ETFs and index funds are good. Some mutual funds are high-cost. | Good. Indexed option is low-cost; others are not. | Good. ETFs and index funds are good. Some mutual funds are high-cost. |
| TIAA-CREF | Good. Some low-fee index funds are available; CREF annuities may be OK. | Not competitive. High fees. | Good. Fees are low in some states, high in others. | Not competitive. High fees. |
| Vanguard | Excellent: Lowest fees, full set of indexed funds, managed funds, ETFs. | Excellent: Lowest fees, full set of indexed funds, managed funds, ETFs. | Excellent: Low fees for all options & states. | Good: Low-fee funds require some oversight. |
Performance Over Time
Rebalancing
Having launched one of the basic portfolios, you will need to do some work (not much!) to keep it aligned with your original intentions. A simple method that works well is to check it every year when you prepare your taxes. Review the two questions at the beginning of this article, to see if your answers have changed. Then calculate the percentage of your account actually invested in stocks (U.S. plus international). If it's off-target by more than 3%, move money between funds so as to restore the right percentages.
Some years, no action will be required. If you need help, you can very likely call your investment firm, give them your target percentages, and get them to set up the transaction. Or, if you are willing to take a more active approach, you'll find good ideas in our article on rebalancing.
Expected Gains & Losses
No portfolio is immune to losses, not even money-market funds, bank deposits, and T-Bills. They may pay back all the dollars you invested, with interest, but sometimes inflation can overpower the interest and cause your real buying power to decline. Stock funds and bond funds have historically offered protection against inflation, if held long enough, but in the short-term they may suffer declines, possibly sharp ones.
To sensibly monitor the health and wealth of your basic portfolio, without driving yourself nutty, try this:
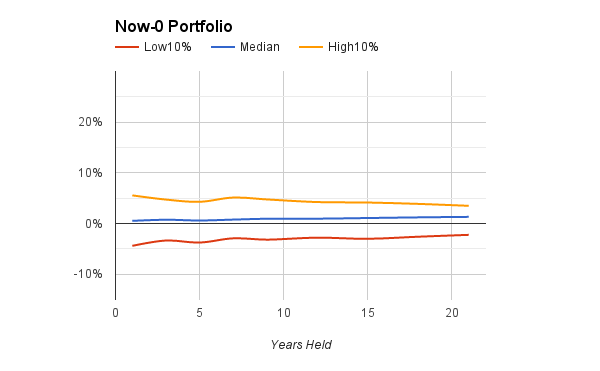
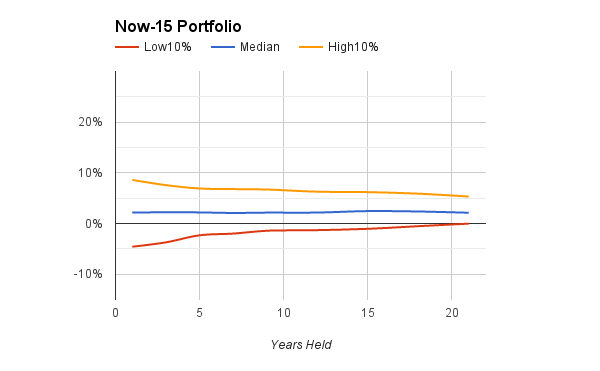
The first two charts show how the Now-0 and Now-15 portfolios would have performed, if held for periods of 1, 2, 3 years or more, up to 21 years, after correcting for inflation during those periods. The middle (blue) line in each chart shows that both portfolios typically grew 1% to 2% faster than inflation each year, whether held for a year or two, or for a decade or two. Half the time, the gains would have been above the middle line; half the time, below. (Statistically, It's the median.) For something approximating a worst-case view, the bottom (red) line shows the low 10% of the outcomes. The two red lines reveal that across all one-year and two-year periods, about 10% of time, the investment lost some buying power. In these worst-case outcomes, each $100 you invested would have grown to about $101 nominal dollars in your hand after a year, but your housing, groceries, and other bills would have risen to about $106.
Having launched one of the basic portfolios, you will need to do some work (not much!) to keep it aligned with your original intentions. A simple method that works well is to check it every year when you prepare your taxes. Review the two questions at the beginning of this article, to see if your answers have changed. Then calculate the percentage of your account actually invested in stocks (U.S. plus international). If it's off-target by more than 3%, move money between funds so as to restore the right percentages.
Some years, no action will be required. If you need help, you can very likely call your investment firm, give them your target percentages, and get them to set up the transaction. Or, if you are willing to take a more active approach, you'll find good ideas in our article on rebalancing.
Expected Gains & Losses
No portfolio is immune to losses, not even money-market funds, bank deposits, and T-Bills. They may pay back all the dollars you invested, with interest, but sometimes inflation can overpower the interest and cause your real buying power to decline. Stock funds and bond funds have historically offered protection against inflation, if held long enough, but in the short-term they may suffer declines, possibly sharp ones.
To sensibly monitor the health and wealth of your basic portfolio, without driving yourself nutty, try this:
- Don't check it often. Seriously. There's actually some evidence that investors who check their portfolio less often might get better returns, perhaps because they don't sell in a panic or buy on a spree. The annual check-in at tax-time may suffice.
- Know what's reasonable to expect, given the target you've chosen. Toward that end, consider the charts below, derived from our research on U.S. stocks and bonds from January 1934 to December 2014.*
The first two charts show how the Now-0 and Now-15 portfolios would have performed, if held for periods of 1, 2, 3 years or more, up to 21 years, after correcting for inflation during those periods. The middle (blue) line in each chart shows that both portfolios typically grew 1% to 2% faster than inflation each year, whether held for a year or two, or for a decade or two. Half the time, the gains would have been above the middle line; half the time, below. (Statistically, It's the median.) For something approximating a worst-case view, the bottom (red) line shows the low 10% of the outcomes. The two red lines reveal that across all one-year and two-year periods, about 10% of time, the investment lost some buying power. In these worst-case outcomes, each $100 you invested would have grown to about $101 nominal dollars in your hand after a year, but your housing, groceries, and other bills would have risen to about $106.
|
|
The upshot is that these two portfolios, although designed to keep losses small, will in practice suffer an occasional lapse. For peace of mind, you might keep a cushion of about 10% more than you think you'll spend, if you've elected a Now-0 or Now-15 portfolio.
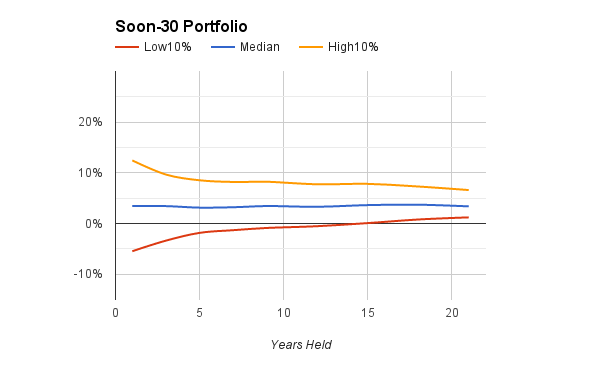
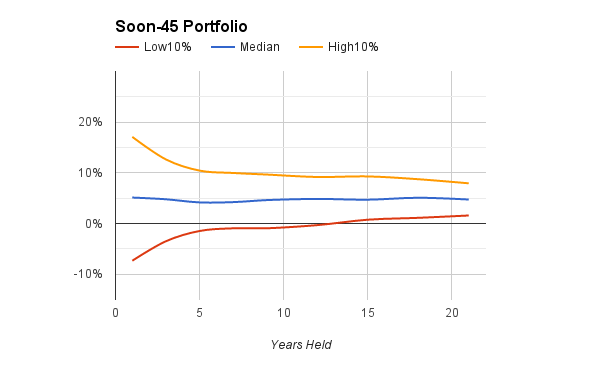
Compare the charts above to the ones below, which show historical results for the Soon-30 and Soon-45 portfolios. Notice that the middle lines are higher. The Soon-30 and Soon-45 portfolios tended to generate gains of 3% to 5% per year above inflation, which is certainly not shabby. If held just a year or two, they were more variable than the previous portfolios, as shown by the wider cones at the left side of the chart. But by three to five years, their worst-case line (low 10%) was only about 1% to 3% below inflation annually. And on the upside, the best-case performance, shown by the top (orange) line, sometimes saw large annual gains.
|
|
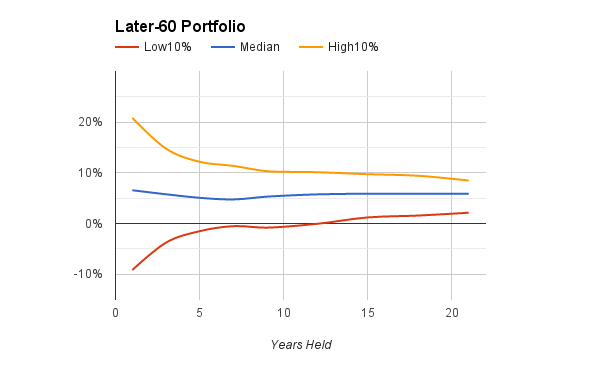
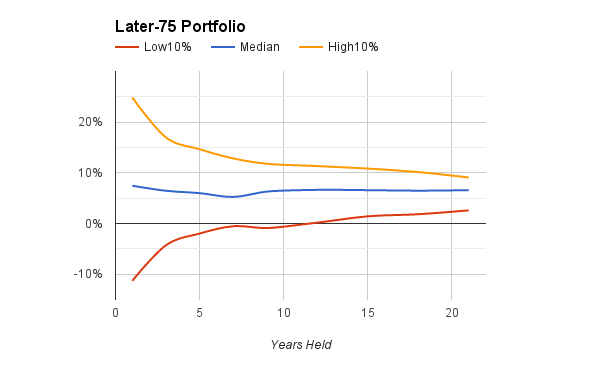
Finally, two more charts show the performance of the Later-60 and Later-75 portfolios. These are intended to be long-term investments, lasting many years. If sold prematurely after five years or less, they had more extreme results than the other portfolios, growing well over 10% annually above inflation in the best of times, and sinking nearly as much in the worst of times. But look what happened to the worst-case bottom line after 10 years or more. It crept up above zero. In short, these portfolios, like any that are heavy on stocks, offered the best protection against inflation, if held long enough. Furthermore, their median returns were around 5% to 6% better than inflation, which is most definitely what you need when saving for college or retirement.
|
|
In short, don't panic if your Later-60 or Later-75 portfolio takes a tumble for a year or two, and don't go ballistic with joy if either one skyrockets for a while. They are built for the long-haul, at least five years and, more likely, 10 to 20 or more.
Disclaimer: Historical data cannot guarantee future results. Although a mixture of bonds, stocks, and other investments may be safer than investing exclusively in one class of assets, diversification cannot guarantee a positive return. Losses are always possible with any investment strategy. Nothing here is intended as an endorsement, offer, or solicitation for any particular investment, security, firm, or type of insurance. You are responsible for your own investment decisions. Please read our full disclosures and Fiduciary Oath.
* Data sources: Robert Shiller's data library for large-company U.S. stocks and 10-year Treasury bonds. FRED for 2-year Treasury notes since 1976 and 3-month Treasury Bills since 1934. Statistical regression on 10-year Treasuries and 3-month T-Bills since 1976 was used to estimate 2-year Treasury notes between 1934 and 1975. The analysis was limited to U.S. stocks, as insufficient data is available on international stocks before 1972. The data-points were monthly. Consequently, there were, for example, 960 one-year periods, starting in January, February, March and every other month from 1934 through December 2013. At the other extreme, there were 708 21-year periods. Statistically, these are not independent data-points, as the time periods overlapped, and ordinary (unadjusted) tests of statistical significance would therefore be inappropriate.