To build wealth, your portfolio must grow faster than the economy. In doing so, it should outpace inflation if given enough time, but it may be volatile, with swings that mimic economic cycles. This article explains how to capture most of the up-trends, while limiting some of the downturns. It is decidedly an article about long-term investing. For shorter-term savings, visit the News or Investing page and enter "short-term" in the search bar.
Goals to Build Wealth
If you could craft an ideal portfolio for your investments, what would it do? It's not about what the portfolio should contain. It's about the objectives you want it to achieve. Because that comes first.
Sometimes, investors and advisers rashly skip this step and jump to asking whether your portfolio should have stocks from developed or emerging countries, contain high-yield bonds, be oriented toward value or growth, have small-caps or big blues, or include REITs or commodity-funds. Questions like these, about so-called “asset classes” or “styles,” are premature.
To get started on building wealth and to steer a proper course, one must first set goals. Let’s assume that, for you, the main goals of an ideal portfolio would be to:
In academic jargon, these goals align with large-scale economic influences, or macro-factors. You want your portfolio to:
Sounds good, doesn’t it? If the economy grows, your wealth grows even faster. If inflation erupts, your portfolio adapts and your buying power is protected. Should a recession occur, coupled with deflation, your wealth would be intact. You would never lose sleep over the dips and drama of stock markets or interest rates.
Of course, this dreamy portfolio doesn’t exist. One can only approximate it. To see why, consider how three types of investments have fared historically against the macro-factors.
Sometimes, investors and advisers rashly skip this step and jump to asking whether your portfolio should have stocks from developed or emerging countries, contain high-yield bonds, be oriented toward value or growth, have small-caps or big blues, or include REITs or commodity-funds. Questions like these, about so-called “asset classes” or “styles,” are premature.
To get started on building wealth and to steer a proper course, one must first set goals. Let’s assume that, for you, the main goals of an ideal portfolio would be to:
- Grow your wealth over time.
- Protect your buying power.
- Avoid losses generally, and steep ones especially.
In academic jargon, these goals align with large-scale economic influences, or macro-factors. You want your portfolio to:
- surpass the country’s economic growth, and …
- outpace both inflation and deflation, yet …
- mitigate volatility, especially when it’s negative.
Sounds good, doesn’t it? If the economy grows, your wealth grows even faster. If inflation erupts, your portfolio adapts and your buying power is protected. Should a recession occur, coupled with deflation, your wealth would be intact. You would never lose sleep over the dips and drama of stock markets or interest rates.
Of course, this dreamy portfolio doesn’t exist. One can only approximate it. To see why, consider how three types of investments have fared historically against the macro-factors.
History
Stocks, if history can be taken as a guide, will grow faster than the economy and inflation over many years. But their ability to protect buying power is much weaker in the short run, and they are vulnerable to steep losses.
Treasury bonds with maturities of 10 to 30 years are backed by a government guarantee of repayment. They will grow enough to beat inflation over several years, but will build wealth at a slightly slower pace than the economy grows. Although less volatile than stocks, they may lag inflation, sometimes for years.
Short-term Treasury bonds and bank-savings that are backed by a government guarantee will have the most stable returns (the least volatility). But their returns will be less than stocks and long-term bonds. In the long run, they will fall far behind the growth of the economy. In the very short-run, however, they may adapt to inflation more quickly than stocks or longer-term bonds.
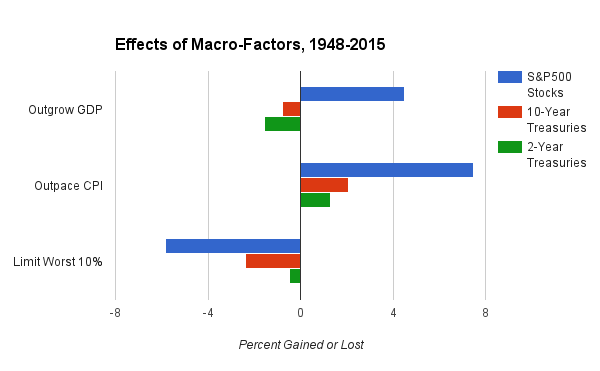
These points are captured in the chart above. It is based on the performance of S&P 500 stocks, 10-year U.S. Treasury Bonds, 2-year U.S. Treasury Notes, inflation in U.S. consumer prices, and growth in the U.S. Gross Domestic Product (GDP), between January 1948 and June 2015. The measurements in the chart are intended to represent the macro-factors of economic growth, inflation, and negative volatility.
The lesson to be drawn from this analysis is that none of the three investments, by itself, would accomplish all the goals of growing wealth, protecting buying power, and limiting losses. Stocks were the clear winner on two criteria and a big loser on the third. Bonds, whether short-term or long-term, had less dramatic losses but also gave more modest gains.
You could use the chart to set some rough benchmarks. Suppose, for example, that your portfolio were invested evenly in the three assets, 33.3% each, and you smartly rebalanced your holdings to keep the percentages from drifting more than 5% off-target. Then over the 67-year period covered by the chart, your wealth would have grown about 0.8% faster than the economy, outpaced inflation by 3.7% annually, and, in its worst months, suffered declines of about 1.9%. Each of these numbers is better than you would have gotten by investing entirely in 10-year Treasury bonds. Thus, by diversifying evenly and rebalancing smartly, you took less risk of loss, more strongly beat inflation, and more vigorously outpaced the economy, compared to a non-diversified portfolio of safe Treasury bonds. That's a powerful argument in favor of diversifying your portfolio to include both stocks and bonds.
- The top panel shows how the investments fared in comparison to the growth of the U.S. economy (GDP). Stocks grew much faster than the economy, but 10-year Treasuries fell short by 0.8% per year, and 2-year Treasuries, by 1.5%. The message is clear. To grow at or above the rate of the economy, your portfolio needs a dose of stocks.
- The middle panel in the chart shows that after adjusting for inflation, as measured by the Consumer Price Index (CPI), all three types of investments generated positive returns over the 67-year period of the analysis. They all beat inflation in the long run, with stocks doing the best by far, followed by 10-year bonds, then 2-year bonds.
- The bottom panel concerns volatility. It depicts the average return during the months when an investment had its worst losses. Specifically, it shows the average of the months that ranked in the bottom 10% over the entire period. The worst months for stocks averaged a loss of 5.8%. That’s a sharp decline in a short period. Bonds also had some losses in their worst months, but smaller ones, about 2.4% on average for 10-year Treasuries and 0.5% for 2-year Treasuries.
The lesson to be drawn from this analysis is that none of the three investments, by itself, would accomplish all the goals of growing wealth, protecting buying power, and limiting losses. Stocks were the clear winner on two criteria and a big loser on the third. Bonds, whether short-term or long-term, had less dramatic losses but also gave more modest gains.
You could use the chart to set some rough benchmarks. Suppose, for example, that your portfolio were invested evenly in the three assets, 33.3% each, and you smartly rebalanced your holdings to keep the percentages from drifting more than 5% off-target. Then over the 67-year period covered by the chart, your wealth would have grown about 0.8% faster than the economy, outpaced inflation by 3.7% annually, and, in its worst months, suffered declines of about 1.9%. Each of these numbers is better than you would have gotten by investing entirely in 10-year Treasury bonds. Thus, by diversifying evenly and rebalancing smartly, you took less risk of loss, more strongly beat inflation, and more vigorously outpaced the economy, compared to a non-diversified portfolio of safe Treasury bonds. That's a powerful argument in favor of diversifying your portfolio to include both stocks and bonds.
Examples
If a diversified mix of stocks and bonds is best for building wealth, what's the right mix? The answer depends on your time-horizon and your tolerance for swings, up or down, in your portfolio's value. The longer you intend to hold your investments, and the more you can tolerate temporary losses, the more you should invest in stocks.
That said, at able2pay.com we recommend you consider some boundaries:
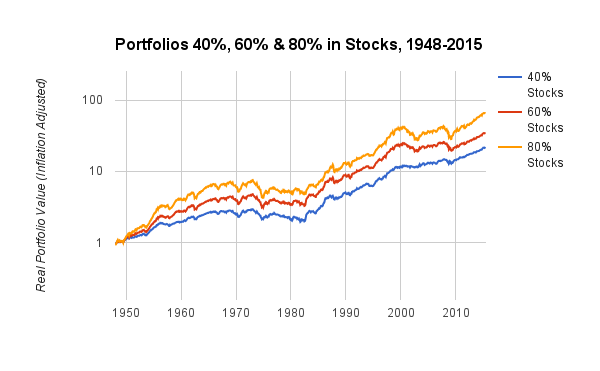
Consider the following chart. It shows the performance of portfolios invested 40%, 60%, or 80% in large-company U.S. stocks, with the remainder in 10-year Treasury bonds, over the period from January 1, 1948, through June 30, 2015.
That said, at able2pay.com we recommend you consider some boundaries:
- 40% in stocks is a reasonable minimum for long-term investors. With this amount in stocks and the rest in 10-to-30 year Treasury bonds, your portfolio's risk of loss would be similar, historically, to holding 10-year Treasuries exclusively. But the gains would be much better.
- 80% in stocks may be the maximum, although some would argue for 90%. If you rebalanced your portfolio at 80% in stocks and the rest in 10-to-30 year Treasuries, the long-term gains would be similar, historically, to holding a portfolio invested entirely in stocks. But the risk of loss would be less.
Consider the following chart. It shows the performance of portfolios invested 40%, 60%, or 80% in large-company U.S. stocks, with the remainder in 10-year Treasury bonds, over the period from January 1, 1948, through June 30, 2015.
The chart shows the portfolios' buying power (the value after adjusting for inflation, plotted on a log scale). Over the 67.5 years in the chart, all three portfolios would have grown your wealth substantially. Expressed as real gains in buying power, the 40% portfolio grew at an annual rate of 4.6%; the 60% portfolio, at 5.3%; and the 80% portfolio, at 6.4%.
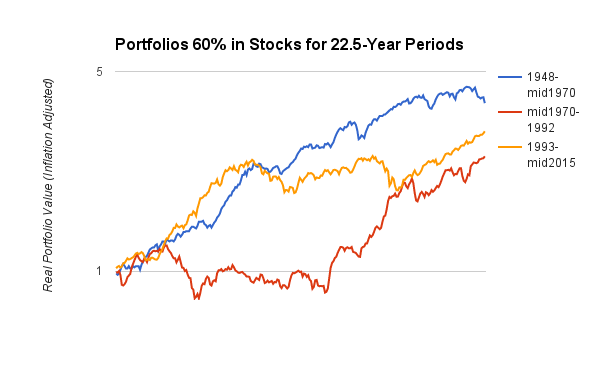
The growth was uneven, however. Each portfolio had various periods of stagnation, temporary loss, and sustained growth. Furthermore, most of us won't be investing for 67 consecutive years. Our experience might be more like the examples shown in the next chart. It depicts a portfolio invested 60% in stocks over the first, middle, and final thirds of the period from 1948 to mid-2015.
The growth was uneven, however. Each portfolio had various periods of stagnation, temporary loss, and sustained growth. Furthermore, most of us won't be investing for 67 consecutive years. Our experience might be more like the examples shown in the next chart. It depicts a portfolio invested 60% in stocks over the first, middle, and final thirds of the period from 1948 to mid-2015.
Each of the three periods in the chart is 22.5 years in duration. Each had a time of stagnation: at the end of the 1948-1970 period, the beginning of the 1970-1992 period, and the middle of the 1993-2015 period. Yet, by the end, all three periods produced solid gains. In a word, a long-term investor has to be patient.
To Learn More
To begin building your own portfolio, some additional ideas may be helpful:
- To keep your portfolio aligned with your targets, read our article on Rebalancing and adopt a method that works for you.
- To fine-tune the types and amounts of stocks and bonds in your portfolio, read about your portfolio's term and start using our Best-Invest calculator.
Disclaimer: Historical data cannot guarantee future results. Although a mixture of bonds, stocks, and other investments may be safer than investing exclusively in one class of assets, diversification cannot guarantee a positive return. Losses are always possible with any investment strategy. Nothing here is intended as an endorsement, offer, or solicitation for any particular investment, security, firm, or type of insurance. You are responsible for your own investment decisions. Please read our full disclosures and Fiduciary Oath.


