
Should you be investing in stocks (for growth)? In bonds (for safety)? In some of each (for peace of mind, perhaps)? And for how long? To get a decent return from stocks, how long must you wait? What if you need the money sooner? This article examines these questions, and shows how the Best-Invest calculator at able2pay.com can help you answer them for yourself.
A 20-Year Example
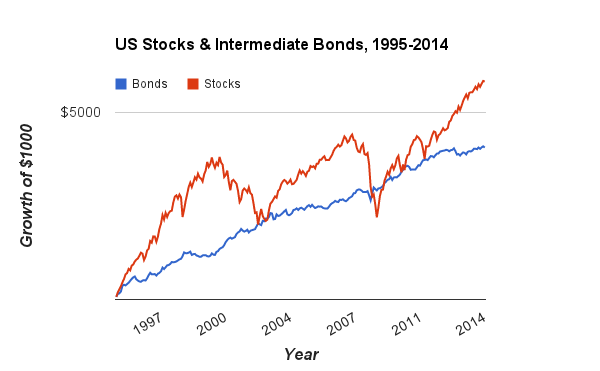
Suppose that in January 1995, you put $1000 in a broad index of U.S. stocks or the same amount in a broad index of U.S. 6-10 year bonds. Here's a chart that shows how your investments would have fared for the next 20 years. (The data are from Yahoo Finance, for Vanguard's Total Stock Market Index Fund and their Intermediate-Term Bond Index Fund, with dividends reinvested.)
Over two decades, $1000 invested completely in U.S. stocks grew to $6496. It was a bumpy ride. More than a few investors were spooked by the sharp down-turns that started in 2000 and 2007, sold all their stocks, and missed the big gains from 2009 to 2014. In contrast, over the same 20 years, a smoother ride in bonds took a $1000 investment to $3685. There was less pain along the way, but less gain in the end.
This particular 20-year period is not unique. Historically, U.S. stocks have reliably out-performed U.S. bonds for periods of 20 years or more. Over 10 to 15 years, stocks have tended to do better than bonds, while over 5 to 10 years, it's been a toss-up. In short, the longer you held them, the higher the likelihood that stocks out-performed bonds.
Alas, time and again, stocks have also been more volatile. Dramatic swoops and swoons may diminish their appeal. Furthermore, there's no guarantee that future comparisons will be like the historical ones. It's entirely possible that in our lifetimes, the holding period when stocks reliably do better than bonds could shift downward (maybe to 10+ years) or upward (to 30+ years).
One final, very important point about this chart is that it exhibits the same deceptive limitation as the charts that investment firms typically report. Inflation is ignored. During the 20 years from 1995 to 2014, consumer prices in the U.S. inflated at a compound rate of 2.3% per year. Cumulatively, even a low rate of 2.3% really adds up over 20 years. The compound effect was to reduce the real value of the 20-year outcome in stocks from $6496 to $4141; likewise, the 20-year result for bonds fell from $3685 to $2349. Had these holdings merely stayed even with inflation, the end-outcome, after adjustment, would have been $1000. Thankfully, they did better than that. Both stocks and bonds rose beyond that level, but by less than the raw numbers in the chart would mislead you to think. To reflect realistic changes in the purchasing power of investments, our calculators use inflation-adjusted data.
When Stocks Make Sense
Knowing all this, does it make sense to put a large portion of one's money in stocks? Sometimes, for some people, yes. The better questions are when does it make sense and for whom? As general guidance, a large allocation to stocks makes the most sense when four criteria are met:
1) The portfolio is balanced, with less than 100% in stocks. Why a balance of stocks and bonds? Why not go all-in on stocks? Had you invested 100% in U.S. stocks since 1871, your compound return, adjusted for inflation, would have been 6.85% per year. Putting 90% in stocks and the other 10% in bonds would have reduced the return to 6.59%. In effect, a 90-10 balance of stocks and bonds came at a mark-down of about 0.26% per year.
It's a price worth paying. One good reason is that you may end up spending small portions of your investments, even if your original intent is to hold them indefinitely. Allocating something to bonds is a hedge against your possible future spending. Another reason is that having a portion set aside in bonds enables you to invest more in stocks if they suffer a downdraft and suddenly become cheap. Historically, had you re-balanced into stocks on the rare occasions when they took a big plunge, your long-run returns would have recovered the 0.26% mark-down, or more.
2) Dividends from stocks and interest from bonds are redirected to maintain the desired balance. This part is easy. A simple, very effective strategy is to save all dividends and interest temporarily in a short-term bond or money market fund. You can instruct your investment firm to do this. Then, on some regular schedule, perhaps quarterly or monthly, redirect the saved amounts to the portion of your portfolio that's below its target allocation. For example, if your target were to have 85% in stocks and they have risen to 88%, move the saved dividends and interest to your bond fund. Or vice versa if your stocks fall to 82%. Some good investment firms do this automatically.
3) The investments are allowed to grow, neither sold in a panic nor bought on impulse. Staying the course may be hard for some. Our calculators at able2pay.com ask some questions intended to estimate a level of exposure to stocks that's both financially prudent and emotionally sustainable for you. Is your goal to maximize gains, minimize losses, or do both? Can you accept ups and downs in the value of your portfolio? Depending on your answers to these questions, the calculator will nudge the recommended allocation to stocks somewhat higher or lower.
The idea is that you have an upper limit, a maximum allocation to stocks. You won't exceed this limit, except perhaps in rare circumstances when stocks are severely under-valued (very cheap, by historical norms). For investments you plan to hold for 15 to 20 years or longer, you should go right up to this limit, except when stocks might have become over-valued (very expensive, by historical norms). Our research on the U.S. markets since 1871 says the limit should be between 40%, for the most cautious investors, and 90%, for the most daring. The 40% level has historically minimized losses in long-term investments of 15 to 20 years, after adjusting for inflation. In fact, this allocation affords better protection against long-term losses, including lost buying power, than even a long-term portfolio invested entirely in U.S. 10-year Treasury Bonds. At the higher end, a 90% limit leaves some room for adjustments if stocks become cheap or expensive.
Setting your maximum level is important because it enables you to estimate how much you need to save to reach your long-term financial objectives. For example, suppose that in order to retire 25 years from now, you will need to spend $50,000 annually from savings. To reach that goal, you would have to save more every year if your personal limit is 50% in stocks than if it's 80%. That's because a 50% stock-allocation will grow more slowly (and with less volatility) than an 80% allocation. Your options, in effect, are to put more of your earnings into bonds and savings, anticipating a smoother rider, or more into stocks and accept a more dramatic journey. Either way can get you to your destination.
Ultimately, you have to judge what works for you, given your goals and preferences. What really counts is to pick your level and maintain it. Letting temporary emotions guide your investments, selling in a panic when markets deep-dive or buying in excitement when they skyrocket, are among the surest ways to reduce your long-term returns and jeopardize your financial plans.
4) The investments have years to grow. It sounds simple, but there are hidden complications. If you are 30 and investing to retire in your 60's, the solution is clear. Your entire portfolio is long-term and should be at your upper-limit for stocks. At the other extreme, suppose you are investing to buy a home three years from now. Then none of your portfolio is long-term, and your stock allocation should be much smaller. Extensive analysis of historical data implies that the upper-limits of 40% to 90% for long-term holdings should be reduced to a range of 10% to perhaps 40% for near-term holdings of three years or less. And for expenses within the current year, nothing should be invested in stocks, or even in bonds; this money belongs in bank deposits or similarly safe accounts.
Time Is Tricky
Often, investments are meant to cover a mix of near-term and long-term needs. That's the tricky part.
Consider, for example, a 63-year-old who's planning to retire at 65. Then some investments will be spent in two to five years; these are near-term. But a 63-year-old's life-expectancy may be 90 years. So savings are needed for expenses that span a 25-year period starting two years from now and ending around 27 years hence.
Doing the math for the hypothetical 63-year-old, seven of the 25 years to be spent in retirement are 20 or more years in the future. So about 28% of the savings (7 of 25) could be invested strongly in stocks. Another portion, perhaps 20% covering the first five years, would have a conservative exposure to stocks. In between, an even balance of stocks and bonds might make sense. The math quickly gets complex. Fortunately, you don't have to do it. Our calculators ask the right questions, then do all the necessary computations. Given your answers about your personal upper-limit for exposure to stocks, and about when you will start and stop spending your investments, the calculators present an overall balance between stocks and bonds that's customized for you.
Disclaimer: Historical data cannot guarantee future results. Although a mixture of bonds, stocks, and other investments may be safer than investing exclusively in one class of assets, diversification cannot guarantee a positive return. Losses are always possible with any investment strategy. Nothing here is intended as an endorsement, offer, or solicitation for any particular investment, security, firm, or type of insurance. You are responsible for your own investment decisions. Please read our full disclosures and Fiduciary Oath.