
The calculators at able2pay.com use extensive historical data on the stock and bond markets, life-expectancy data, state and federal benefit formulas, and more. Some information is needed about your age, circumstances, and preferences. None of that information is saved anywhere or shared with anyone.
This article explains how to understand and use the calculators. There are four sections:
This article explains how to understand and use the calculators. There are four sections:
- Overview summarizes what each calculator does.
- FAQs provide short answers to questions you may have.
- Tips are suggestions for how to apply the results from the calculators.
- Calculations are the internal methods, including the underlying math and assumptions.
Overview
- Best-Invest is a good place to start for any financial plan. It asks about your goals and key dates, then suggests allocations to stocks, bonds, and savings.
- Safe Payout gives options for safely spending your retirement savings. It takes into account what matters most to you: spending as much as you safely can, or smoothing your budget to match inflation, or leaving a bequest for your heirs.
- Retiree Reserves estimates how much a retired person should save for medical expenses, long-term care, and home upkeep. It also recommends how to invest a reserve fund for such expenses.
FAQs

Are my answers saved? No. To ensure your privacy, Able to Pay LLC never stores any data or information from a calculator. You'll have to re-enter your answers next time you use the calculator. Temporarily, however, your browser may store some information locally, on your computer. We recommend closing or refreshing your browser after using our calculators.
Can I print the results? Yes. Use your browser's tool for saving the webpage or printing it to a PDF.
Why did the calculator freeze? You may have omitted an answer to a required question. Check whether your browser is set to allow pop-ups at www.able2pay.com, as our calculators use pop-up alerts when required information is missing. Another possibility is that you changed some answers and clicked a button to see updated results, but the calculator did not find a reason to change its results (see the next FAQ).
Will a calculator always give the same results? It depends. If you change your answers, the results normally will change. An exception is that if you indicate very short-term plans, where you will spend all your investments this year or next, a calculator might generate the same cautious plan, no matter how you answer any other questions. Additionally, we may update the calculators, to fix problems or add new features. An update may sometimes generate slightly different results if you re-enter the same answers you previously gave before the update. You can find the date of the most recent update in the footer beneath the calculator, along with explanatory notes.
What does "maximize gains" mean? The short answer is that if your goal is to maximize gains and you are willing to tolerate market fluctuations, the calculator may recommend investing up to 85% in fairly valued stocks, for investments you plan to hold for many years. Even for near-term holdings, it may recommend investing mostly in stocks. For more details, see the section on Calculations.
What does "minimize losses" mean? The short answer is that if your goal is to minimize losses and you have little tolerance for market fluctuations, the calculator will recommend investing no more than 45% in fairly valued stocks, for investments held many years. It will recommend even less in stocks for near-term holdings, but won't go below 10% unless you plan to spend all your savings within a year or two. More details are in the section on Calculations.
What does "normal allocation" mean? These are reasonable ways to distribute your investments across stocks, bonds, and cash-equivalents when stock-prices are at the middle of historical valuations. If stock-prices were neither expensive nor cheap, compared to long-term historical values, a normal allocation would be best for your goals.
What does "value adjusted" mean? These recommendations take into account whether U.S. stock prices are currently over- or under-valued, compared to historical norms. Occasionally, we update the data for evaluating stock-prices in ways that may cause the value-adjusted results to change. When U.S. stocks become over-valued (relatively expensive), the value-adjusted percentage for U.S. stocks will decrease, and the percentage of bonds will rise. When U.S. stocks are under-valued (relatively cheap), the results will adjust in the opposite manner, with more in stocks and less in bonds.
How does the calculator use my retirement age or the years when I start or stop spending my investments? If you will spend some or all of your investments soon, the calculator will display a more cautious plan. Conversely, if all your investments are to be spent far in the future, the calculator will show a plan near the highest percentage of stocks that fits your goals. In between, the calculator uses a statistical model that's explained in the section on Calculations.
How accurate is the predicted return? It's an estimate, not a guarantee. It's the best estimate we can give, taking into account your goals, the current over- or under-valuation of U.S. stock prices, and long-term historical trends. Unknown factors like future inflation or deflation, market dynamics, and changes in interest rates or your personal goals can cause your actual gains or losses to be different from the expected return. The estimate is most accurate for the next year or two.
Are fees covered? No. The calculators make no assumption about how much you will pay, either to the funds you own or to a financial adviser. Your fees could be as low as 0.1% if you use low-cost funds and manage them yourself, or over 1% if you use high-cost funds or advisers. You should subtract your fees from the predicted return that the calculator estimates.
Tips

Are all-in-one or target-date funds suitable? Definitely. If you can find an all-in-one or target-date fund whose allocations match the calculator's results, check the fund's fees. If they are under 0.4% ($4 per $1000 per year), that's a good solution. Alternatively, you could use the all-in-one or target-date fund as a guide, and craft your own portfolio with index funds comparable to the ones inside the all-in-one or target-date fund. Then you would have to do your own re-balancing, but you may get better returns plus reduced fees, for a double-benefit. A good strategy is to check your funds quarterly, re-run our calculator, and re-balance your funds if either the total percentage in stocks or the total percentage in bonds differs by 3% or more from what the calculator generates.
What about international stocks? Although our calculators were developed from long-term data on U.S. stocks, some international stocks may be sensible for many investors. Specifically:
How might you invest in bonds? For portfolios with 40% or more in stocks, an index fund of long-term U.S. Treasury bonds would have worked well, historically. Check the average maturity of the bonds in the fund; it should be 20 years or so, definitely more than 10 years. With less than 40% in stocks, however, history suggests using long-term, highly rated corporate bonds. If you may start spending the investments in 1 to 5 years, the calculator will display short-term bonds for some or nearly all of your bond investments, and long-term bonds for the rest. In this case, you might opt for a fund with 1-to-5 year bonds issued by the U.S. government for the short-term portion. An alternative strategy is to place all your bond investments into a single fund that tracks the total (or "aggregate") U.S. bond market, or an index fund for U.S. intermediate bonds. Our analysis of historical data suggests that putting all your bond savings in one fund of this sort is simpler, but may, in the long run, return slightly less than specific targeting of corporate or Treasury bonds. If you have a third or more of your portfolio in bonds, consider putting 10% to 20% of your total portfolio into an international bond fund. In doing so, limit your exposure to currency risks by selecting a fund that holds dollar-denominated bonds or, better yet, uses currency-hedging. Vanguard's Total International Bond Market Index Fund is a good example of a low-fee, currency-hedged vehicle for non-U.S. bonds.
How might you invest in short-term bonds or CDs? Our calculators display short-term bonds or CDs for the portion of your portfolio that may be spent within 5 years. Consequently, your short-term bonds or CDs should have maturities of 1 to 5 years. Over this time-frame, a sudden, unexpected spike in inflation, if it happened, would hurt your buying power. Accordingly, short-term Treasury Inflation Indexed Securities (commonly called TIPS) might be considered, as well. To craft a reasonable mix of securities, consider these points:
When should you keep cash-equivalents? The calculators display cash-equivalents only for money to be spend within 12 months. Cash equivalents include bank savings accounts, money-market funds, and T-Bills. These carry a risk of falling behind the inflation rate (as happened in from 2014 to 2017, when interest rates were very low). However, they guarantee that you will get your dollars back, possibly with some interest, even though the buying power of those dollars may sometimes decline.
What about a financial adviser? Can an adviser help you select the right funds and re-balance them? Of course. Is it worth the expense? Probably not, if fund-selection and re-balancing are the only services the adviser gives you. You can almost certainly find an all-in-one fund with low-fees and automatic re-balancing that reasonably approximates our calculator's results. A financial adviser will likely charge from 0.3% to 1.0% of your portfolio value. If in return you get good advice on other matters, such as planning for major expenses, establishing a trust, or managing your taxes, then the adviser's fees may be worthwhile. Before going there, consult our articles on good, low-cost Investment Firms and on Finding Advice.
What about international stocks? Although our calculators were developed from long-term data on U.S. stocks, some international stocks may be sensible for many investors. Specifically:
- When more than 33% of a portfolio is in stocks, the calculator will propose a 70-30 split: 70% of the stock-portion to be invested in a broad basket of US stocks, and 30% in a fund capturing a broad index of non-US stocks.
- When less than 33% is recommended for stocks overall, the calculator will put the entire stock-portion in a broad index of US stocks.
How might you invest in bonds? For portfolios with 40% or more in stocks, an index fund of long-term U.S. Treasury bonds would have worked well, historically. Check the average maturity of the bonds in the fund; it should be 20 years or so, definitely more than 10 years. With less than 40% in stocks, however, history suggests using long-term, highly rated corporate bonds. If you may start spending the investments in 1 to 5 years, the calculator will display short-term bonds for some or nearly all of your bond investments, and long-term bonds for the rest. In this case, you might opt for a fund with 1-to-5 year bonds issued by the U.S. government for the short-term portion. An alternative strategy is to place all your bond investments into a single fund that tracks the total (or "aggregate") U.S. bond market, or an index fund for U.S. intermediate bonds. Our analysis of historical data suggests that putting all your bond savings in one fund of this sort is simpler, but may, in the long run, return slightly less than specific targeting of corporate or Treasury bonds. If you have a third or more of your portfolio in bonds, consider putting 10% to 20% of your total portfolio into an international bond fund. In doing so, limit your exposure to currency risks by selecting a fund that holds dollar-denominated bonds or, better yet, uses currency-hedging. Vanguard's Total International Bond Market Index Fund is a good example of a low-fee, currency-hedged vehicle for non-U.S. bonds.
How might you invest in short-term bonds or CDs? Our calculators display short-term bonds or CDs for the portion of your portfolio that may be spent within 5 years. Consequently, your short-term bonds or CDs should have maturities of 1 to 5 years. Over this time-frame, a sudden, unexpected spike in inflation, if it happened, would hurt your buying power. Accordingly, short-term Treasury Inflation Indexed Securities (commonly called TIPS) might be considered, as well. To craft a reasonable mix of securities, consider these points:
- Historically, U.S. Treasury bond-funds with average maturities of 2 years or less have responded more quickly to inflation than other types of near-term investments. These funds retire and replace their holdings quickly enough to raise their interest rates soon after inflation rises. Consider them first.
- With TIPS, historical data suggest that short-term securities respond faster to inflation than intermediate- and long-term TIPS. Additionally, TIPS are biased in the direction of expected inflation (what the broad market thinks will happen). If the expectations prove to be wrong (as they often do), then returns on TIPS may suffer. For these reasons, some investors will decide to split their short-term bonds between TIPS and Treasuries, and to invest none of their intermediate- or long-term bonds in TIPS.
- If you are investing in CDs, first compare the interest rate to that of a short-term U.S. government bond fund. When purchasing CDs, consider using a ladder with some maturing in 1 year, some in 2 years, and the rest in 3 years. That will enable you to roll over part of your savings each year to capture higher rates, if inflation is rising.
When should you keep cash-equivalents? The calculators display cash-equivalents only for money to be spend within 12 months. Cash equivalents include bank savings accounts, money-market funds, and T-Bills. These carry a risk of falling behind the inflation rate (as happened in from 2014 to 2017, when interest rates were very low). However, they guarantee that you will get your dollars back, possibly with some interest, even though the buying power of those dollars may sometimes decline.
What about a financial adviser? Can an adviser help you select the right funds and re-balance them? Of course. Is it worth the expense? Probably not, if fund-selection and re-balancing are the only services the adviser gives you. You can almost certainly find an all-in-one fund with low-fees and automatic re-balancing that reasonably approximates our calculator's results. A financial adviser will likely charge from 0.3% to 1.0% of your portfolio value. If in return you get good advice on other matters, such as planning for major expenses, establishing a trust, or managing your taxes, then the adviser's fees may be worthwhile. Before going there, consult our articles on good, low-cost Investment Firms and on Finding Advice.
Calculations

Building the calculators. Our calculators are tested against monthly data compiled by Nobel economist Robert Shiller for large-company U.S. stocks, U.S. 10-year Treasury Bonds, and U.S. consumer prices. Additional monthly data was obtained from the U.S. Treasury Department for U.S. 2-year Treasury Notes, U.S. Treasury 20-year bonds, A-rated corporate bonds, and 3-month U.S. Treasury Bills. Shiller's data covered the period from January 1871 to December 2015. The data from the Treasury department covered 1976 to 2015 for 2-year Notes, 1953-2015 for 20-year Treasuries, 1919 to 2015 for corporate bonds, and 1920 to 2015 for Treasury Bills. In some cases, a statistical model was used to interpolate missing values. With this data, we derived historical results for portfolios with various combinations of these securities, over holding periods from 1 to 24 years. In doing so, we were able to answer questions like this example: "Over all time-periods of 3-years, starting in every month since 1920, what would an investor have experienced with a portfolio of 30% U.S. large company stocks, 60% U.S. 10-year Treasury Bonds, and 10% U.S. 2-year Treasury Notes?" By varying the holding periods, portfolios, and dates, we identified the combinations of stocks, bonds, and notes that were optimal for particular investment goals and time-horizons.
Defining risk. A method often used to construct investment portfolios is to seek the best return for a given level of risk. Typically, risk is defined as the magnitude of the standard deviation, a statistical measure that tells how much a portfolio's gains or losses fluctuate month-to-month or year-to-year. High fluctuation is deemed risky. Conceptually, our method was the same, but we defined "risk" in a different manner. In particular, we did two things differently:
Minimizing loss. When studying portfolios and holding periods (for example, a 50-50 split of stocks and bonds, held for 12 years), we calculated all the historical instances of that duration (in the example, all 12-year periods), filtering them down to the ones that, at the end of the period, resulted in a loss. We then found the total of those losses across all possible instances of that portfolio for that holding period, on monthly data, for the longest history possible in our dataset. Going a step further, we then found the total loss across other holding periods, for the same portfolio. By doing so, we were able to find a mathematical model (described below) that minimized losses over all holding periods, for a particular portfolio. (In the example, we found the total losses for the 50-50 split, across all possible periods of 1, 2, 3, 4, 5, 6, 8, 10, 12, 16, 20, and 24 years.)
Maximizing gain. As noted above, we sought a risk-adjusted gain, where risk was defined as loss, not as variation. Specifically, we used a measure (a cross-product) that rewarded a high compound return and penalized total losses. Going one step further, we applied this measure to a conservative portfolio invested equally in 2-year and 10-year Treasury Bonds, using the bond-performance as a baseline. In effect, our way of measuring maximum, risk-adjusted gain was to ask: What portfolio showed the best combination of high returns and low losses, compared to the combined returns and losses of 2-year and 10-year Treasuries? We answered this question across all holding periods, for various portfolios, to construct an optimal mathematical model (described below).
Constraints. The calculators have some constraints (limits) on the recommendations they generate:
Defining risk. A method often used to construct investment portfolios is to seek the best return for a given level of risk. Typically, risk is defined as the magnitude of the standard deviation, a statistical measure that tells how much a portfolio's gains or losses fluctuate month-to-month or year-to-year. High fluctuation is deemed risky. Conceptually, our method was the same, but we defined "risk" in a different manner. In particular, we did two things differently:
- We used inflation-adjusted returns. Thus, for example, in a year when bonds returned the original dollars plus 2% interest, but inflation was 3%, we recorded a 1% loss, not a gain. Following Shiller's lead, we adjusted for inflation every month on every security. This method contrasts with typical methods that use nominal returns and thus count bond-interest and stock-dividends as universally positive, even when they represent diminished buying power because of inflation.
- We counted loss-variation as risky, but ignored gain-variation. For example, if a particular strategy resulted in gains in almost every 5-year holding period, we counted it as low-risk for 5-year holdings, even if the size of the gains varied widely from one 5-year period to another. In this respect, our calculators departed from the more typical methods that always count higher variation as less desirable, even when it represents a so-called "risk" of bigger gains.
Minimizing loss. When studying portfolios and holding periods (for example, a 50-50 split of stocks and bonds, held for 12 years), we calculated all the historical instances of that duration (in the example, all 12-year periods), filtering them down to the ones that, at the end of the period, resulted in a loss. We then found the total of those losses across all possible instances of that portfolio for that holding period, on monthly data, for the longest history possible in our dataset. Going a step further, we then found the total loss across other holding periods, for the same portfolio. By doing so, we were able to find a mathematical model (described below) that minimized losses over all holding periods, for a particular portfolio. (In the example, we found the total losses for the 50-50 split, across all possible periods of 1, 2, 3, 4, 5, 6, 8, 10, 12, 16, 20, and 24 years.)
Maximizing gain. As noted above, we sought a risk-adjusted gain, where risk was defined as loss, not as variation. Specifically, we used a measure (a cross-product) that rewarded a high compound return and penalized total losses. Going one step further, we applied this measure to a conservative portfolio invested equally in 2-year and 10-year Treasury Bonds, using the bond-performance as a baseline. In effect, our way of measuring maximum, risk-adjusted gain was to ask: What portfolio showed the best combination of high returns and low losses, compared to the combined returns and losses of 2-year and 10-year Treasuries? We answered this question across all holding periods, for various portfolios, to construct an optimal mathematical model (described below).
Constraints. The calculators have some constraints (limits) on the recommendations they generate:
- In the current year (which the calculators count as year zero), expenses are assumed to be paid from cash in some form: a bank savings account, Treasury Bills, or a money-market fund. Over the long-term, holding cash poses a serious risk of lost buying power, because of inflation. Cash is prudent, however, for paying immediate expenses, particularly when held in guaranteed securities such as bank savings and Treasury Bills.
- Investments for year one (12 to 24 months from now) are recommended to be invested 10% in stocks, a small percentage in long-term bonds, and the rest (a majority) in short-term U.S. government bonds. A portfolio with this mix of securities was found in our analyses to be optimal for a one-year holding period. It's optimal because, historically, it maximized gains while keeping inflation-adjusted losses at slightly better levels than holding 100% in intermediate and short-term bonds. The small allocation of 10% to stocks counteracts the bond-risk of losing to inflation in one-year holdings.
- Short-term bonds are phased out of all portfolios, gradually, starting at year 2 and continuing somewhat beyond year 10. As they are phased out, the investments shift to stocks and long-term bonds in a manner that increases overall returns more than it raises the risk of losses. In our analyses, the gradual phase-out nicely balanced the objectives of making the portfolio manageable, limiting losses, and sustaining long-term growth.
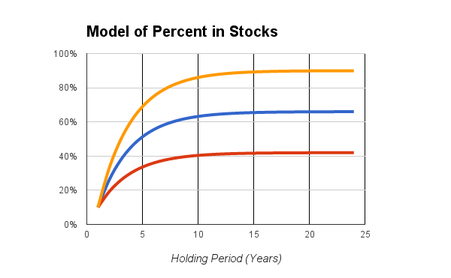
Mathematical model. Various mathematical models were examined to determine the simplest one that best fit the historical data, given the investors' goals, constraints, and holding periods, as described above. Two well-known models, a Gompertz function and a logistic function, are solutions for modeling growth over time (in this case, growth of the percentage allocated to stocks over holding periods of increasing duration). They seemed attractive because they generate "S" shaped curves, similar to the "glide-paths" used in many target-date retirement funds. However, a better fit was obtained with a simpler function that generated what resembles a hill-climb toward a plateau, as illustrated in the accompanying chart. The top line in the chart is for maximizing gains; the bottom one, for minimizing losses; and the middle one, for doing both. Expressed in a format similar to a spreadsheet function, the best-fitting function was of the form:
p = m + a * ( 1 - EXP( - ( y-1)/h ) ), where:
Adjusted values. A final nuance of the calculators is that they apply some adjustments for CAPE, Shiller's metric for whether stock-prices are over-valued or undervalued. In brief, two adjustments are made:
p = m + a * ( 1 - EXP( - ( y-1)/h ) ), where:
- p is the fraction of the portfolio allocated to stocks.
- m is the minimum portion in stocks, set to 0.1 or 10% as noted above.
- a is the asymptote or plateau, which depends on the investor's goal.
- y is the holding period in years.
- h sets the steepness of the hill-climb, roughly marking the year when a portfolio is halfway between its minimum and plateau levels.
Adjusted values. A final nuance of the calculators is that they apply some adjustments for CAPE, Shiller's metric for whether stock-prices are over-valued or undervalued. In brief, two adjustments are made:
- When the calculators report the expected return of a portfolio, the reported value is adjusted upward if stocks are currently under-valued, and downward if they are over-valued. This adjustment is based on ideas presented here.
- Each of the segmented, one-year slices of a holding period has its stock-allocation modified in a manner that, over all the historical data and holding periods, was found to incrementally improve on the twin goals to maximize gains and minimize losses. The method of adjustment involves using a logistic transform of stock-allocations and logarithms of CAPE values, weighted according to a statistical analysis.