
Measured by CAPE, stocks in the U.S. seem expensive now. But CAPE has an historical bias. In the early 20th century, it drifted to consistently low values; in recent decades, to persistently high ones. These trends occurred whether the stock market was booming or busting. After removing CAPE's apparent bias, stocks in 2016 seem nearly normal. Which of these opposing views is more credible?

As noted in an earlier post, CAPE is a uniquely reliable predictor of future stock prices. It tends to correctly forecast the long-term direction, up or down, although it does better for the distant future than for next month or even the next year or two. A refined version of CAPE, called LogrCAPE0.33%, is shown below for the years from 1896 through 2015.*
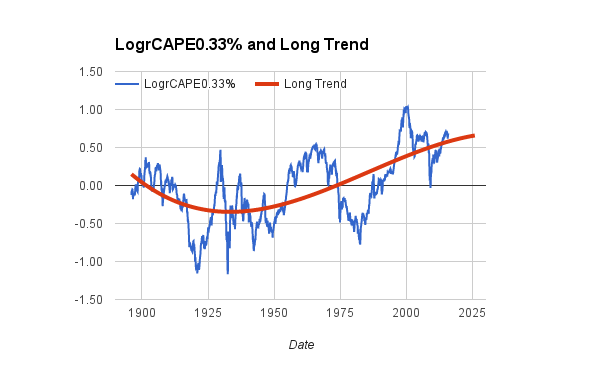
Right now, the computed value of this version of CAPE is above 0.5, as indicate by the last plotted value at the right end of the blue line. That's higher than the market peaks in 1929 and the late 1960's, which were excellent times to cut back on stock-ownership. However, the long-term trend of CAPE, plotted with the red line, suggests that CAPE was depressed in value throughout the early 20th century, then rose to higher levels in recent decades. A majority of the below-zero observations occurred before 1950, yet virtually every value since the late 1980's has been above zero. An extension of the trend-line suggests that CAPE may continue to have high relative values for another decade or more.
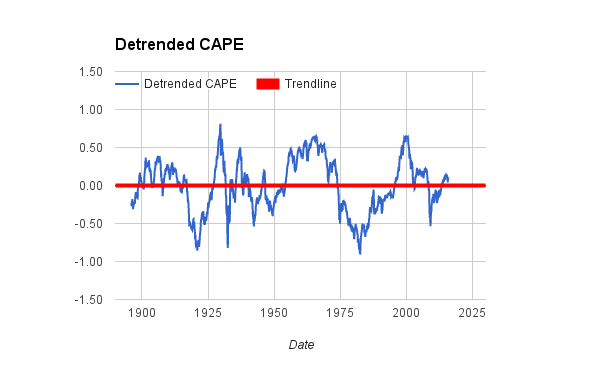
It's reasonable to ask whether CAPE would be a better predictor if its long trend were taken into consideration. Accordingly, the next chart adjusts the LogrCAPE0.33% metric by removing the trend.** The picture is more balanced, with values above and below zero occurring in every quarter-century. And the new trend-line is flat (a statistical necessity). Looking at recent values, the selloff in 2008 and early 2009 now looks like a good buying opportunity, with the de-trended CAPE hitting a low of -0.5. The current, near-normal value raises no alarm to avoid stocks.
It's reasonable to ask whether CAPE would be a better predictor if its long trend were taken into consideration. Accordingly, the next chart adjusts the LogrCAPE0.33% metric by removing the trend.** The picture is more balanced, with values above and below zero occurring in every quarter-century. And the new trend-line is flat (a statistical necessity). Looking at recent values, the selloff in 2008 and early 2009 now looks like a good buying opportunity, with the de-trended CAPE hitting a low of -0.5. The current, near-normal value raises no alarm to avoid stocks.
One reason to be skeptical of the de-trended CAPE is that many other indicators say stocks are over-valued and are thus likely to weaken in the future. But what if all the indicators, including CAPE, share the same historical bias? Perhaps something about global economies or contemporary finance has changed fundamentally since late in the last century and will persist for decades to come. Maybe investors have more confidence in long-term payoffs from owning stocks because they see value in more global trade, or in better management of national economies, or in reduced fear of world wars and pandemics. Who knows? Lending credence to this speculation is a telling statistic. In a comprehensive analysis of U.S. markets since 1896 for periods of owning stocks from 1 to 40 years, the de-trended CAPE explained more variance (26%) in real returns than did LogrCAPE0.33% (20%).***
A rational person could take either side of the argument. Our calculators strike a compromise. They report value-adjusted allocations to stocks and bonds by first averaging LogrCAPE0.33% and the de-trended CAPE, then estimating allocations and returns from that average. Additional details about the statistical machinery of the calculators are posted here.
A rational person could take either side of the argument. Our calculators strike a compromise. They report value-adjusted allocations to stocks and bonds by first averaging LogrCAPE0.33% and the de-trended CAPE, then estimating allocations and returns from that average. Additional details about the statistical machinery of the calculators are posted here.
* For improved statistical results, the refined version computes a very long-term 0.33% exponential average of companies' earnings, instead of the classical 10-year ordinary average. It then takes the natural logarithm this ratio: current, inflation-adjusted prices divided by the exponentially averaged earnings. In a slight improvement on the standard method, the current month's price adds in the inflation-adjusted value of one month of dividends.
** The trend-line is a log-linear cubic polynomial. The de-trended CAPE is simply LogrCAPE0.33% minus the value predicted by the least square fit of the cubic model.
*** The to-be-predicted variable in the analysis was the actual, inflation-adjusted, compound annual return of U.S. stocks, with dividends reinvested. The returns were computed for all holding periods from one to 20 years, plus all even-numbered holding periods from 22 to 40 years, from January 1896 through December 2015. In a least-squares regression, the observed returns were predicted from a combination of CAPE and the holding period, using a function of the form r = b * c * POWER( m, y ) + a, where r is the log-real-return; c is the de-trended CAPE or LogrCAPE0.33%; a, b, and m are fitted constants; and y is the holding period.

 RSS Feed