
This post was part of a series on building a portfolio of mutual funds or Exchange Traded Funds. Much of the series has been moved to articles on the Portfolios menu:
On the topic of inflation, Andrew Ang's fine textbook, Asset Management, offers many good insights, to which I am much indebted (see his chapter 11). I've superimposed my own analysis, however, and sometimes relied on additional sources.
- Basic Portfolios: Some simple ideas that work remarkably well.
- Diversify: Effective ways to diversify with bonds and stocks, globally.
- Factor Investing: Specialized portfolios that employ techniques from academic research.
- Respond to Inflation: Realistic options for inflation-protection, near-term and long-term. (Not yet moved, this topic is covered below, in this post.
On the topic of inflation, Andrew Ang's fine textbook, Asset Management, offers many good insights, to which I am much indebted (see his chapter 11). I've superimposed my own analysis, however, and sometimes relied on additional sources.
Overview
It's helpful, I think, to focus on inflation with three sets of questions:
- Near-term: At a given time and for the next year or two, how should an investor's portfolio adapt to inflation or, equally important, to deflation? This question matters if, and only if, you plan to spend some of your investments in the next year or two.
- Long-term: What investments, if held a long time, will best protect against inflation? Do the same investments protect against deflation? And how long is long enough?
- Correlates: Both near-term and long-term, what investments (if any) are correlated with inflation (or deflation)? If one applies diversification criteria, do any of the popular candidates, such as TIPS, commodities, and real estate, truly add value?
Near-Term
Here's an interesting test. You come to me in December, asking "What will inflation be next year?" I caution that nobody knows the perfect answer, but one indicator is quite good and amazingly simple. "It has correlated 0.64 with next year's inflation for the past 100 years," I proclaim. Then I show you data for the past century, using the chart below. Can you guess what my indicator is?
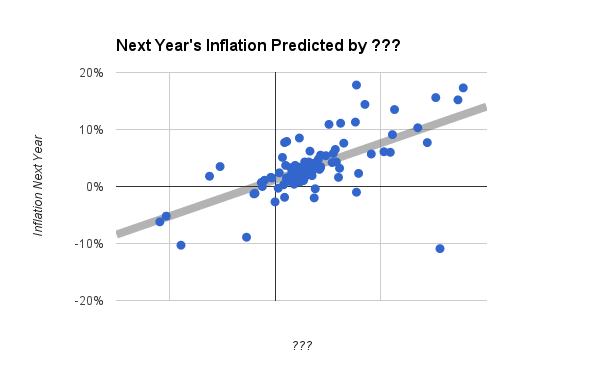
No, it's not the price of oil or gold. It's not the return on inflation-indexed bonds, or the median price of homes, or any exotic financial product. And it's a lot simpler than the economic model favored by this year's hot economist. It's last year's inflation. Yup. Next year's inflation is pretty well predicted by inflation over the most recent 12 months. That's because inflation (or lack of it) tends to persist. *
Despite the dire tone of some articles and commentary, inflation is not like a thief in the night who steals your heirloom jewelry, sets your home ablaze, and swiftly vanishes before dawn, leaving your wealth devastated. He's more like the unwelcome guest, your financially reckless cousin, who emails you one day and shows up on your couch the next, feasts from your pantry, maxes all your credit accounts, totals your car, and requires strenuous measures to be evicted, leaving you poor, thin, weary, and forgiveably ungracious after a prolonged ordeal.
The point is that you'll know when inflation is becoming a problem. One of the more obvious clues will be that interest rates are rising. That clue, as it happens, also defines your best defense.
T-Bills
As Ang and others before him have pointed out, the asset most strongly correlated with inflation and the best single hedge against it is a 3-month Treasury Bill. As inflation rises or falls, the interest rate on T-Bills tends to follow. Because T-Bills can be redeemed and reinvested at the newest rate every three months, the response to inflation, although lagging somewhat, is timely.
Even so, it's not a perfect hedge, mainly because policies of the Federal Reserve sometimes (not always!) hold T-Bill rates below the inflation rate. That happened for nearly two decades during the Great Depression and World War II, and again, more recently, for six years and still counting since the financial panic of 2008-2009.
These limitations notwithstanding, a T-Bill offers good protection against inflation for expenses you know you will have to pay within the next year or so. Here's a concrete example:
- A hypothetical saver needs $1000 per month to pay expenses that are not covered by her other sources of income, such as work, Social Security, or an annuity.
- In late December, she has $3000 in a bank account (earning next to nothing) to cover her expenses through March. She withdraws $12,000 from her investment or retirement account, and buys a 3-month T-Bill. (She can do so easily and with no fees whatsoever at www.treasurydirect.gov.)
- In April, she redeems the T-Bill and puts enough in her bank account to cover the next three months' expenses. If her expenses have risen (or fallen) a bit in the past three months, she sensibly increases (or decreases) the amount set aside in her bank account, thus maintaining a smooth standard of living. (To simulate these adjustments, I exactly matched them to the change in consumer prices, up or down, for the previous quarter.) The remainder gets reinvested in a new 3-month T-Bill.
- She does the same in July and October.
- At the end of December, she looks at the amount she will get by redeeming the most recent T-Bill, to see if it will cover the first three months of the coming year. She wants it to cover her real expenses, which may have risen above $1000 per month because of inflation over the past year.
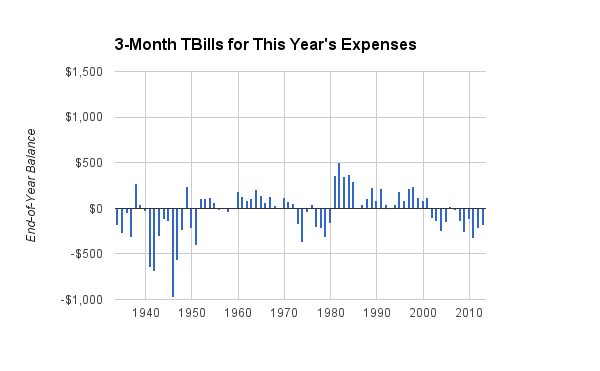
Before 1952, when interest rates were restrained by the federal government, the results were weak. On average, the amount available after a year was nearly 9% less than the amount needed for the next three months. These were desperate times, financially, and it is not clear that any one-year savings plan could have done better.
From 1952 through 2014, the results were good. On average, there was a real 1% surplus, and surpluses occurred much more often than deficits. On the assumption that future federal policies may resemble those enforced since the early 1950's, the T-Bill strategy looks attractive.
Short-Term Treasuries
What if you were willing to take a bit of a chance on longer-term bonds? For example, how about a short-term Treasury fund whose bonds have average maturities around 2 years? One might expect such a fund to respond to inflation less quickly than T-Bills, but to pay a higher rate of interest and to be penalized somewhat less when federal policies suppress the interest on T-Bills. The next chart shows the results from using 2-year Treasuries instead of 3-month T-Bills.
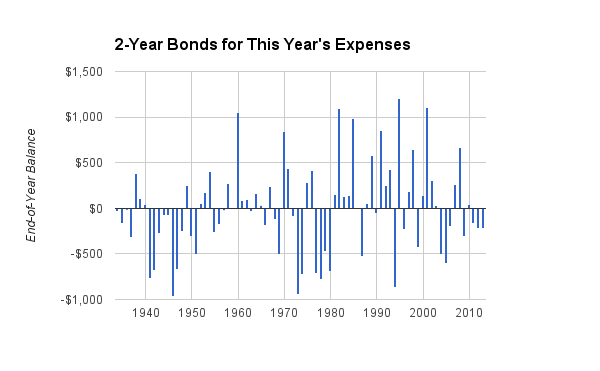
Clearly, there is much more variation from year to year, which is not good for budgeting. On the other hand, the average surplus for the period 1952-2014 was higher, around 2%. In several years, the surplus was a full month's expenses. Here's an idea: What if the surpluses were carried over, to offset subsequent deficits?
A variant of that idea turns out to be highly effective, perhaps the best strategy of all. It works like this:
A variant of that idea turns out to be highly effective, perhaps the best strategy of all. It works like this:
- In the first year, save two years' expenses ($24,000 for our hypothetical saver) instead of one ($12,000).
- Use a fund of 2-year Treasuries instead of T-Bills.
- Don't spend any surplus. Don't try to replenish any deficit. Simply add next year's expenses at the end of each year, adjusted according to the past year's inflation, exactly as in the T-Bill strategy.
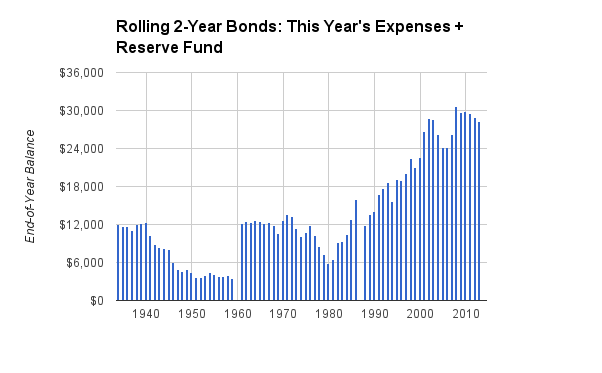
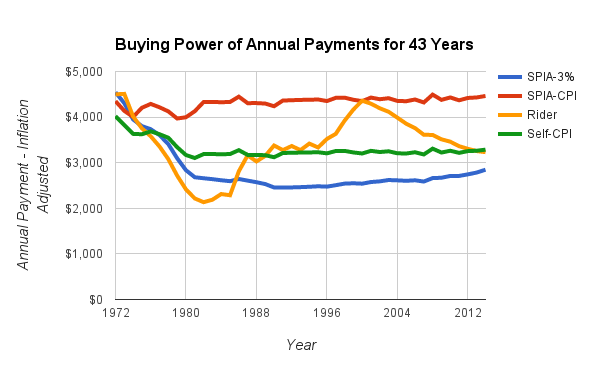
This strategy accumulates unspent surpluses over time, even in difficult periods. The chart above illustrates how the strategy would have worked in three very different 26-year periods. The first period, 1934-1959, saw a toxic mix of occasional high inflation, recessions with steep deflation, and persistent suppression of Treasury rates. During this time, the strategy lost some of its reserves but never went to ground. Bear in mind that the values in the chart are real dollars (inflation adjusted). Thus, the $3000 of buying power that remained on reserve at the end of 1959 would have seemed much larger in nominal dollars. The second period, 1961-1986, spanned multiple recessions and successive years of high inflation. Yet it maintained good reserves throughout. The final period, 1988-2013, benefited from a bull market in Treasuries and ended with enough surplus to cover more than two years of inflation-adjusted expenses.
Short-Term TIPS
Originally, they were called Treasury Inflation-Protected Securities, or TIPS. But they never truly guaranteed protection from inflation, and the Treasury Department now calls them Treasury Inflation Indexed Notes or TIINs, if their maturity is five years. The new name is apt because in recent times, their value as an inflation hedge has been about as good as, well, TIIN.
Surprised? Consider this example. In October 2010, you could have bought TIPS from the Treasury Department that would mature four years and eight months later, in April 2015. Those TIPS would have paid a measly interest rate of 0.5%, which would have seemed reasonable because T-Bills paid even less. At the time, the big institutions that bid at Treasury auctions expected inflation to start rising. So they bid up the price of the TIPS, thereby forcing buyers to pay, on average, $1055 for a bond that could be redeemed in nearly five years for $1000 plus inflation. They were counting on inflation to recoup the extra $55 and then some. As it all worked out, the cumulative inflation between October 2010 and April 2015 was 8.2% (equivalent to 1.7% per year). The buyer was therefore paid about $1082 in April 2015, plus those flimsy interest payments twice a year. For the initial investment of $1055, the buyer got a real (inflation adjusted) total return of about 1% per year. The five-year bet on inflation paid off, in this case.
But what if the original buyers' expectations were wrong? It can happen. In July 2014, no one anticipated that inflation for the next 12 months would be virtually zero, but that's what it was (0.2%). If you had bid on TIPS in early 2014 expecting a 1% real return, you would be holding a loss after the first year. Because mutual funds and ETFs buy, sell, and redeem TIPS continuously, they are vulnerable to such miscalculations. They can lose money when their inflation bets are too high.
For some evidence, consider the chart below. It shows the real (inflation-adjusted) returns since late 2009 for two funds: STPZ, the PIMCO ETF for short-term TIPS; and VSGBX, a Vanguard fund for short-term bonds from the Treasury Department and other federal agencies. The PIMCO fund holds TIPS exclusively; the Vanguard fund holds no TIPS at all. Over the six-year period, both funds virtually matched inflation, with a terminal value near $1.00 for every dollar originally invested. But the TIPS fund was more volatile, rising or falling as its inflation bets came out winners or losers.
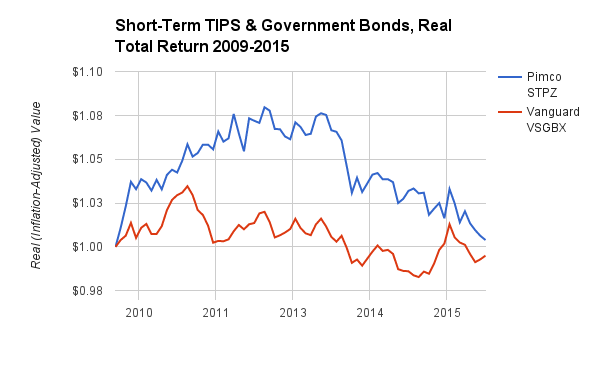
It would be nice to know if the long-term trend will resemble the short history shown in this chart. Alas, six years is the longest history available for a short-term TIPS fund as of September 2015. Pending additional evidence, a rational investor could use a short-term TIPS fund, instead of short-term Treasuries, but the outcome might not be any better, and the ride may be less smooth. An educated guess is that short-term TIPS may do better when inflation is rising, while short-term Treasuries might excel when deflation and recession are lurking.
Lessons
Academic studies and historical data imply that near-term protection against inflation (and deflation) can be secured by either of these strategies:
- Hold a year's worth of anticipated expenses in 3-month T-Bills, redeeming and re-investing every three months. Virtually as good, use a savings or money-market fund if it is safe, very liquid, and pays interest at or above the rate of T-Bills.
- Or, hold two years of anticipated expenses in a fund of short-term U.S. government bonds. Withdraw expenses for a year, and replenish with anticipated expenses for the next year, keeping any surplus on reserve. A fund of short-term TIPS may be reasonable, but other U.S. government bonds are likely to offer more consistent performance.
* In the chart, an outlier that goes against the trend is the solitary point in the lower right quadrant. It's for 1921 when, after World War I brought inflation that exceeded 15% annually, the economy sank sharply into recession. Within the year, high inflation switched to extreme deflation. It's the only such whipsaw in the past century. In fact, it's an exception that proves the rule because the preceding inflationary trend persisted for four years, and the subsequent deflation lasted for two, followed by several years of low inflation and the booming economy of the Roaring Twenties.
Disclaimer: Historical data cannot guarantee future results. Although a mixture of bonds and stocks may be safer than investing exclusively in one class of assets, diversification cannot guarantee a positive return. Losses are always possible with any investment strategy. Nothing here is intended as an endorsement, offer, or solicitation for any particular investment, security, or type of insurance.

 RSS Feed