Able to Pay
  • News
  • Retirement
    • Retired Now
    • Retiring Soon
    • Saving to Retire
  • Goals
    • Ask Yourself
    • Building Wealth
    • Investing to Buy
  • Investing
    • Basic Methods
    • Rebalancing
    • Stocks or Bonds?
    • Investment Fees
    • Best Firms 2016
    • Being Tax-Wise
    • Finding Advice
  • Portfolios
    • Basic Portfolios
    • How Long?
    • Diversify!
    • Factor Investing
    • Finding Value
  • Calculators
    • Best-Invest
    • Safe Payout
    • Retiree Reserves
    • Income Reserves
  • About
    • Why Able to Pay?
    • People

Value & Volatility

9/19/2016

0 Comments

 
In December, able2pay.com will have a fresh analysis of value and volatility in the stock and bond markets. This post is a preview of the topics to be covered.
Picture
  • Low-volatility stock funds have been available for a few years, and new ones are being advertised. Academic research implies they may be effective. Are they? Now? And for whom?
  • Value stocks have long been proclaimed as good investments. But funds define "value" differently. What really works? Is "value" good for everyone?
  • Rebalancing is often said to be good for any portfolio. It's the single most popular topic on this website. If you do it wisely, should you still bother to reduce volatility and boost value?
Always timely, questions like these seem particularly germane now. Stocks are over-valued by many of the traditional metrics; interest rates on bonds imply dismal future returns; and cash has languished below inflation rates for a painfully long period. If no investment has obvious value, does something have to give, and if it does, is there any prudent shelter from the ensuing volatility?
0 Comments

Big or Small, Wild or Safe, Soon or Late?

6/12/2016

0 Comments

 
Accurately measuring whether stocks are over- or under-valued is hard enough. Yet even if that problem were solved, others would remain. An indicator that predicts a big change in stock prices over the near term is likely to have a wild margin of error. Longer term, the error-rate may decline, leading to a safer, more confident prediction, but the price-change will also fade to a smaller size. Is there any way to have it all: calculate a credible benefit, capture it safely, and bank it soon?
Picture


A ​Good Estimate

Earlier posts on this topic proposed how best to measure whether stocks are over- or under-valued. To recap, three ideas are key.
  • According to solid academic studies, Shiller's ten-year CAPE is a good starting point. Andrew Ang's Asset Management (chapter 8, section 5.2 ) explains CAPE's uniquely reliable, if somewhat modest, power as a predictor
  • The standard measurement of CAPE can be improved by computing it over a longer period than ten years with a method that gradually reduces the weight of older data, and by applying logarithms to ensure that high and low readings are judged evenly.
  • Some credence should be given to the possibility that CAPE has its own long-term trend. Predictions can be improve by filtering out this trend, at least partially.
"Corrected CAPE" is the term used here to designate a metric that applies all these ideas. To learn more, follow the links above.

A Safe Benefit

As of early 2016, the corrected CAPE is rather high, approximately +0.4. A corrected CAPE this much above a neutral value of zero implies over-valued stocks, hence a risk that future returns from stocks will be less than normal. Given this reading, how much weakness in stock prices might one expect? Is a swift decline likely, or an extended period of lackluster gains, or what? The answer, it turns out, depends on whether the goal is to predict changes for next year, the next decade, or even farther into the future.
Picture
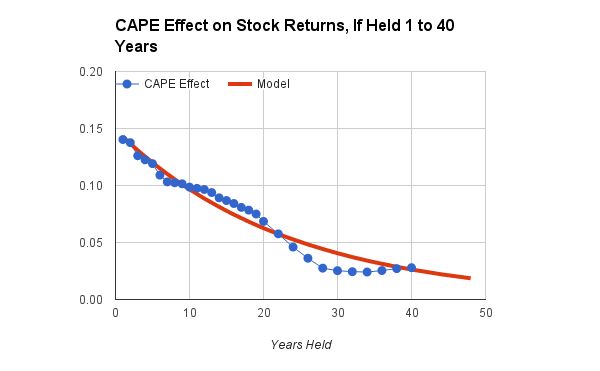
In the chart above, the CAPE Effect is a multiplier that tells how much to adjust the future returns of U.S. stocks, given a value of the corrected CAPE. The blue dots are actual data points from a comprehensive study covering the period from 1896 through 2015. The red line is a statistically fitted model used in our calculators.*

Given corrected CAPE's early 2016 value of +0.4, a one-year forecast is an effect of roughly 0.4 * 0.14 = 0.056 on a log scale. The spreadsheet function EXP(0.056) converts back to a percentage, 5.8%, which is the predicted reduction in real (inflation-adjusted) stock-returns over the next year, because of the current over-valuation. For the 1896-2015 period of the study, compound real returns were about 6.6% per year, so the year-ahead prediction is a return of 6.6% - 5.8%, or a meager 0.8% better than inflation, including reinvested dividends. With economists currently predicting an inflation rate of about 2%, the nominal return would be 2.8%. That's less than the historical return of ten-year Treasury bonds.

​If U.S. stocks were held longer, for the next 20 years, the chart predicts the effect would still be negative but less drastic, roughly half as large. The compound, inflation-adjusted return would be reduced about 2.6%. Instead of enjoying average real returns of 6.6% annually for two decades, one's portfolio of U.S. stocks would grow 6.5% - 2.6% = 4.0% per year, above inflation. That's not shabby. It's better than bonds, but below average for the long-term performance of stocks.

​What the chart says, in short, is that buying stocks today is like paying a premium price for a house when real-estate is hot. Even after holding the investment for many years, one's annualized profits may be tepid.

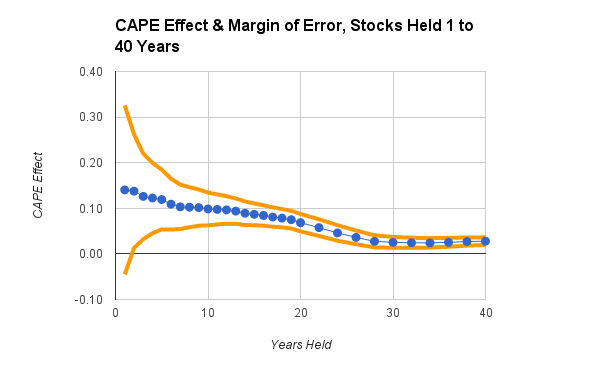
There's a problem, however, in making decisions like these. The next chart shows why. It presents the same data points (the blue dots), bracketed by their margins of error.** Statistically, most of the historical data falls between the upper and lower margins of error (the orange lines). A big gap between the lines implies great uncertainty; a narrow gap means the prediction is more trustworthy.
Picture
For stock investments held one year, the margin of error is extreme. While the average one-year effect might be alluring, actual one-year results have often been very different, in both directions. Evidently, a short-term forecast is both big and wild. It's like predicting tomorrow's weather to be a 90% chance of rain, maybe a steady downpour, maybe a brief drizzle.

At the other extreme, for a holding period of 30 to 40 years, the prediction is much more precise, thanks to a tiny margin of error. It's a safe forecast, but the effect has become small. Now the weather forecast is for a certainty of rain this season, totaling 5 to 6 inches, but there's no telling which days will be wet.

The ideal case would be to find the points on the chart where the range of uncertainty excludes a zero effect, which appears to happen after about three or four years, yet the effect-size remains large enough to matter, which seems possible up to the mid-twenties.

A Reasonable Time

Our calculators quantify these ideas by giving a weight to the corrected CAPE.*** As the margin of error decreases, the weight goes up. At the same time, as the effect-size declines, the weight goes down. The statistical model finds an optimal way to calculate the weights, and, it so happens, the weight steadily increases from one to 24 years, then very gradually declines.  

For a concrete example, start with the chart below. It shows how our calculators simulate the portfolio of a hypothetical investor who matches this description:
  • She has moderate preferences. Her goal is a compromise between maximizing gains and minimizing losses, and she is somewhat able to tolerate ups and downs in her investments.
  • She plans to start spending her savings in two years, when she will retire. Given her health status and current age, she expects to continue spending for a total of 25 years.
  • If she had children, she might add another five or ten years of spending, to allow her heirs to spend-down any residual savings after she dies. But she has no children and prefers to maximize her retirement budget by spending all her investments. Her home equity provides a safety net.
Picture
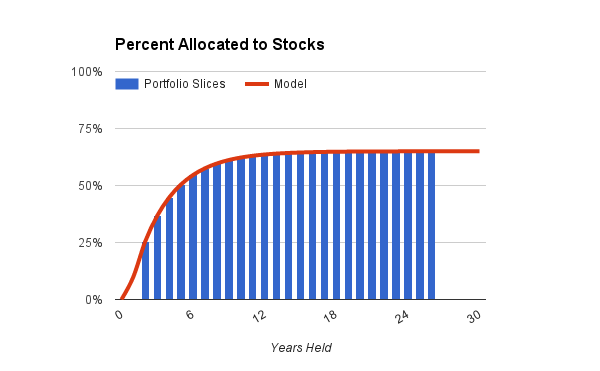
The calculator's statistical model, shown by the red line, sets the investor's exposure to stocks, given her preferences and the time remaining until invested funds will be spent.^ The blue bars are slices or portions of her portfolio, one for each year of anticipated spending.

Because this particular investor's preferences are moderate, the calculator assigns 65% as her maximum exposure to stocks, for investments held 20 years or longer. Anything not invested in stocks goes to bonds, at durations that depend on how soon the funds will be spent.

More than half the portfolio will be held 12 years or longer, and is therefor invested near the maximum level of 65% stocks and 35% bonds. The other half is invested with increasing caution, depending on proximity to the retirement date. As the investor ages and begins to spend her savings, the blue bars will, in effect, march to the left in the chart while staying under the model's red line, thus causing her portfolio to become more conservative over time. Right now, with retirement still two years away and many years of longevity on the horizon, her investments are, overall, about 60% in stocks.

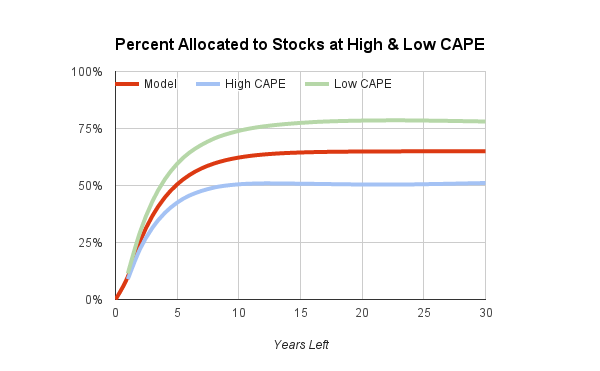
That's without any adjustment for stocks being over- or under-valued. The next chart shows how much this investor's profile would have changed, when adjusted by the corrected CAPE, had the current date been any year between 1920 and 2015. Over those 96 years, 80% of the data fell between the lines shown as High CAPE and Low CAPE (10% were even higher, 10% even lower).
Picture
​As it happens, the corrected CAPE in early 2016 is approaching the value marked by the blue line, where High CAPE means that stocks are over-valued. In times like these, the hypothetical investor's profile gets shifted to the blue line, where the maximum invested in stocks is adjusted down to about 50%. On the other hand, if today's corrected CAPE were like the green line in the chart, with stocks a real bargain (Low CAPE), then more than 75% would be invested in stocks to be held for a decade or more. Notice, however, what happens for near-term holdings that will be spent in two or three years. Here, the calculator makes hardly any adjustment for CAPE.

If the holding period were extended well beyond 30 years, the adjustment would diminish somewhat because the effect of CAPE would very gradually fade. But it would not vanish completely in any normal lifetime. To give a specific example, if you had bought stocks near the top of the dot-com bubble in late 1999, when over-valuation of stocks peaked, your returns, even if you held the stocks for many decades, would likely be poorer than if you had purchased at a more normal price.

One final note is important. Some time in the next decade or two, stocks could take a tumble. If they do, the corrected CAPE may fall to a level that recommends a higher-than-normal exposure to stocks. If you adjust your stock allocation periodically, perhaps every quarter or year, according to the calculator's then-current recommendations, the result will be to move some of your holdings in and out of stocks as they become cheap or expensive, taking into account your evolving plans to spend your savings. In that sense, today's relatively expensive stocks are not a permanent penalty for your portfolio. They are a reason for caution that will last only until more optimism is warranted.

* The data for the study were monthly prices of the S&P 500, or a reasonable surrogate, and corresponding estimates of consumer inflation, from 1871 to 2015, as compiled by Robert Shiller. The period from 1871 to 1895 was used to initialize the values of the corrected CAPE. The plotted points in the chart are slopes from regressing LN(r) on LN(c), where r is the annualized real return on stocks, with dividends reinvested, and LN(c) is the corrected CAPE as described in an earlier post. The fitted line is a power function of the form s = -b * POWER( m, y ) where s is the slope; b and m are fitted constants; and y is the holding period in years.

** Statistically, the margin of error is the standard error of the least-squares estimated slope, on a natural-log scale.

*** The weight is k * s / e, where s is the slope; e, the standard error of the slope; and k, a fitted constant. All are on a natural-log scale. The weight is fitted to optimize the natural-log of the annualized real return.

^ The calculator's model for stock-allocations is an exponential function of the form:
p = q + u * ( 1 - EXP( - (y-1)/v) ),
where p is the portion allocated to stocks; q is a minimum allocation when there is one year left before spending starts; q + u is the upper limit or asymptote of the stock allocation; y is the holding period or "slice"; and v is a factor that controls the rate of rising from the minimum to the asymptote. As described here, this model worked better than other growth functions as a method of optimizing returns.

​
0 Comments

Solving the Annuity Puzzle - Part 3

2/26/2016

0 Comments

 
Picture
Earlier posts in this series reviewed possible explanations for what economists call "the annuity puzzle." The gist of the puzzle is that classical economic theory says retirees should buy more annuities than, in fact, they do. This series of posts can't claim to fully solve the puzzle. Instead, the more modest aim here is to use research by economists to help current and future retirees make good decisions about annuities.

Framing the Options

A decision to buy or avoid an annuity is likely to be better made if it's properly framed. Being well framed means that the choice is stated in a way that counteracts common biases that could otherwise lead to a poor decision. That's the conclusion of a 2008 study published by Jeffrey R. Brown, J. R. Kling, S. Mullainathan, and M. V. Wrobel.

In the study, the authors surveyed 1,342 participants and asked them to evaluate decisions made by hypothetical retirees. The retirees were said to have "made permanent decisions on how to spend a portion of their money in retirement ... each person has some savings and can spend $1,000 each month from social security." Participants were told about the decisions that two such retirees had made and were asked which of the two had made a better choice.

For example, in one comparison, "Mr. Red" made a decision that allowed him to "spend $650 each month for as long as he lives in addition to social security. When he dies, there will be no more payments." He was compared to "Mr. Gray [who] invests $100,000 in an account which earns a 4% interest rate. He can withdraw some or all of the invested money at any time. When he dies, he may leave any remaining money to charity." Given this choice, most participants said Mr. Gray had made the better decision.

However, in another comparison, Mr. Red was the same, but Mr. Gray was described differently. He was able to "choose an amount to spend each month in addition to social security. How long his money lasts depends on how much he spends. If he spends only $400 per month, he has money for as long as he lives. When he dies, he may leave the remainder to charity. If he spends $650 per month, he has money only until age 85. He can spend down faster or slower than each of these options." In this case, most participants said Mr. Red had made the better decision.

Although described differently, these two cases were mathematically equivalent. In both of them, Mr. Red had a lifetime annuity, and Mr. Gray had a savings account earning 4% interest. When the savings account was characterized as in investment (the first case) it was favored over an annuity. However, when the savings account was characterized in terms of the spending pattern it would foster (the second case), it was disfavored.

The study was well designed in a manner that systematically compared a simple lifetime annuity to several other options, including interest-bearing investments and more complex annuities like the ones insurance companies may pitch to skeptical buyers. In every case, the simple lifetime annuity was logically and mathematically the better choice, but it was favored by the participants only when framed in language that clearly stated how each option would affect the retiree's budget and lifelong spending.

Thus, looking at budgets and spending led to better decisions than looking at investment factors such as interest rates and earnings. Focusing on budgets and spending counteracted people's tendencies, described in the previous post in this series, to over-simplify and to miscalculate risks.

Making a Good Decision

Summing up, two points stand out from the various studies reviewed in this series of posts:
  1. Consider your future health costs (for the reasons described in the first post). If you have excellent health insurance, such as a strong Medigap policy and long-term care insurance, then a simple annuity may be a reasonable way to smooth and stabilize your retirement income. If not, then you may be wise to set aside a reserve fund before purchasing an annuity.
  2. Lay out your retirement income and budget without an annuity. Then consider whether purchasing an annuity might improve your lifetime spending. Do this instead of focusing on interest rates, investment returns, or payback periods.
Of course, other factors will also come into play, including your desire to leave bequests to your heirs or charity and your shared income with a spouse or partner, if you have one. For a step-by-step method that incorporates all these considerations, along with specifics regarding the best types of annuities, see our article on annuities for retirees.

Disclaimer: Historical data cannot guarantee future results. Although a mixture of bonds, stocks, and other investments may be safer than investing exclusively in one class of assets, diversification cannot guarantee a positive return. Losses are always possible with any investment strategy. Nothing here is intended as an endorsement, offer, or solicitation for any particular investment, security, firm, or type of insurance. You are responsible for your own investment decisions. Please read our full disclosures and Fiduciary Oath.
0 Comments

Solving the Annuity Puzzle - Part 2

2/23/2016

0 Comments

 
Picture
Classical economic theory says that retirees should prefer annuities over investing in stocks and bonds. But they don't. Why? An earlier post reviewed one explanation, citing a study that said classical theory overlooks how health shocks reduce lifespans and impose burdensome costs. This post reviews other studies offering a second explanation. It examines how retirees think when deciding whether to buy an annuity.

Over-Simplifying a Complex Decision

In 2014, Jeffrey R. Brown, A. Kapteyn, E.  F.  P. Luttmer, and O. S. Mitchell, published a study that examined decisions to buy steady, lifelong annuity payments or to take a one-time, lump-sum payment. They noted that much of the research about such decisions "assumes a rational and fully informed individual who knows ... mortality rates, market returns, inflation, future expenditures, and income, and who can use this knowledge to optimally choose the mix of financial products to smooth" one's future budget over many years. That's a tall order, even for the brightest among us. Most of us may compensate, according to the study, by over-simplifying the decision.

To conduct the study, Brown and his colleagues generated realistic but hypothetical choices between annuities and lump-sum payments, and presented the choices to 2,112 individuals. The data indicated that most participants in the study used "simple heuristics rather than full optimization." The tendency to simplify the decision was strongest for those who had low scores on financial literacy and numerical ability, and those with less education.

A very common method of simplification, even among the more shrewd participants, was to buy an annuity or to trade one for a lump sum only when it was "an exceptionally good deal." While it might seem rational to insist on a good deal, the typical price-points in the study were extreme. On average, the participants were willing to buy an annuity only if the price was marked down by about 75% from the amount they would accept when trading an annuity for a lump sum. That's like offering to buy a new home for $60,000 but, as the owner of the same house, refusing to accept any offer below $250,000. A modest difference between the offer and list prices might make sense, but at values this extreme, a rational sale at fair value won't happen. In short, annuity buyers may have expectations that preclude reasonably priced transactions.

Miscalculating the Risks

Another recent study offers a systematic explanation of the decision process that may guide annuity buyers. Under review for possible publication in an academic journal, the study is by Daniel Gottleib. Using a mathematical model from behavioral economics called Prospect Theory, the study analyzed consumers' decisions to buy or avoid either an annuity or life insurance. Logically, annuities and life insurance are complementary. One pays if you die; the other, if you live. As Gottleib argues, a theory that explains why retirees buy fewer or smaller annuities than is optimal (which they do) may also explain why the same retirees buy more life insurance than is reasonable (which they also do).

Setting aside the sophisticated math of Prospect Theory, one of its core ideas, as Gottleib explains, is that "individuals are risk averse over gains and risk seeking over losses." This means that decisions are based on miscalculation of the true risks. Here are some plain-language examples:
  • Consumers (retirees and younger individuals alike) avoid taking losses. If, for example, they own a stock listed below what they paid for it, they avoid selling the stock at a loss and instead hold onto it, hoping that the price may recover. In doing so, they risk an even greater loss. For an annuity, the irrevocable decision to buy one may seem like a loss, if the buyer worries about dying before receiving enough payments to recoup the original cost. Just as the owner of a losing stock will hold onto it at risk, potential annuity-buyers hold onto their cash at the risk of depleting it, should they live longer than expected.
  • Consumers are also over-eager to take gains. Stock-owners who have a modest gain, for example, may be inclined to sell pre-emptively and not let their profits run. They are averse to the risk that modest gains might vanish. Similarly, one who has held an annuity long enough to receive payments equal to the original purchase price may be reluctant to buy more annuities, even when doing so might be optimal. Logically, for example, it might be wise to increase an annuity if inflation has eroded the value of the original payments or if the buyer's good health has boosted the odds of a very long life. But such wisdom is atypical for retirees.
Gottleib's study offers the cold logic of Prospect Theory to explain decisions like these and similar ones regarding life insurance, including consumers' proclivity to under-purchase life insurance when young and over-purchase it when old. A point in favor of Gottleib's analysis is, thus, the breadth of decisions it covers.

Are Better Decisions Possible?

The foregoing studies imply that when thinking about annuities, we are prone to over-simplify complex decisions and to miscalculate the true risks. Are there ways to counteract these misguided tendencies? Other research suggests that there are, and that better informed choices may be possible. That's the subject of Part 3 in this series.

For step-by-step methods to evaluate whether an annuity would be right for you, including methods to find a good insurance company that sells annuities, read our article on annuities for retirees.

Disclaimer: Historical data cannot guarantee future results. Although a mixture of bonds, stocks, and other investments may be safer than investing exclusively in one class of assets, diversification cannot guarantee a positive return. Losses are always possible with any investment strategy. Nothing here is intended as an endorsement, offer, or solicitation for any particular investment, security, firm, or type of insurance. You are responsible for your own investment decisions. Please read our full disclosures and Fiduciary Oath.
0 Comments

Solving the Annuity Puzzle - Part 1

2/18/2016

0 Comments

 
Picture
Since a ground-breaking study by Menachem Yaari in 1965, economists have called it "the annuity puzzle." Classical economic theory says that retirees should, in a perfectly rational world, prefer annuities over investments such as stocks and bonds.* But they don't. In fact, very few retirees hold annuities. Why? Is the theory wrong? Or are retirees making bad decisions?

There's been plenty of research on the topic since 1965, with no definitive resolution. Some recent studies tackle the problem from very different perspectives. While not written as advice to retirees, the studies do, as I read them, offer useful insights that can sharpen one's thinking about annuities. In this post, I'll explain the core idea from one study. In subsequent posts, I'll discuss additional studies and review what the new research may imply about whether and when a retiree may sensibly consider an annuity.

Health Shocks + Big Costs

The first paper, published in the November 2015 issue of American Economic Review, is by Felix Reichling and Kent Smetters. It aims to resolve the annuity puzzle by examining "​health shocks that simultaneously affect longevity and increase uninsured health costs." Setting aside the elegant mathematics used in the paper, the core idea is quite plausible.

To illustrate the idea, suppose you had purchased a lifetime annuity at age 65. It has paid you a steady stream of income for a few years, just as promised. When you bought the annuity, you had good information about your health. You knew that people with similar health had only a small chance of dying right away and maybe a 50% chance of dying in their 70's. But now, at age 72, you've gotten what Reichling and Smetters call a "health shock." While on vacation in a tropical paradise, you contracted a local disease that nearly did you in. You survived, after a long stay in the hospital, and your future health, alas, now looks bleak. To put a number on it, your chance of dying in your 70's is approaching 90%.

Making matters worse, you had no Medigap coverage, and you needed care from some pricey specialists. Consequently, you've withdrawn much more than planned from your retirement savings. Your personal wealth is much diminished.

The core idea articulated by Reichling and Smetters, supported by mathematics and by data, is that when both these events occur, a health shock that increases the risk of dying plus costs not easily covered by insurance or savings, then annuities become less attractive than holding bonds or other safe investments. Should you live in a world where the combination of such events is plausible, you would, according to Reichling and Smetters, be rational to avoid annuities.

Still, Annuities Work for Some

Nonetheless, in the Reichling-Smetters model, annuities continue to make sense if only one of the unhappy events occurs. Thus, in certain scenarios, annuities may still be attractive. Here are two such scenarios:
  • You've already had a bad health shock. For you, the next shock would be if your health improves, or a medical miracle arrives in the nick of time, and you live longer than the few years you thought you had left. Or, as a less extreme case, your health may be weaker than average because of a chronic condition. Think about it. Wouldn't an annuity be helpful, just in case you find yourself greeting the sunrise far beyond what you pessimistically expect? That's essentially what Reichling and Smetters argue.
  • Your savings and insurance are ample. You can afford to buy an annuity so generous that no health shock would devastate your finances. It might wreck your health, but you would remain financially secure. Alternatively, you may be so shrewd about health insurance and long-term care that you have sufficient coverage for all conceivable costs. Then, whether or not you ever suffer a health shock that actually triggers your insurance benefits, an annuity would be a sensible way to guarantee and stabilize your future income.

Your Options, Reconsidered

Let's revisit your hypothetical self, at age 65, before you took that disastrous vacation. If you were thinking like Reichling and Smetters, you would do one of two things, maybe both.

First, you would set aside some of your retirement savings as a reserve fund for uninsured medical costs. Or you would increase your insurance coverage for medical expenses and long-term care. Doing so would make you less vulnerable to the double-whammy of a health shock that reduces your longevity combined with uncovered costs that degrade your financial viability. To get started, read our article on reserve funds for retirees, and use our Retiree Reserves calculator.

Second, you would buy annuities only to the extent that, after setting aside some reserves or increasing your insurance, you still have ample savings. You would have to review your personal circumstances, perhaps in consultation with a financial professional who receives no compensation for selling annuities or possibly with sophisticated software like ESPlanner.

Aiming to set a benchmark, Reichling and Smetters presented a chart (their Figure 7) indicating that for a healthy 65-year-old, at least $500,000 in savings would be necessary before buying any annuity. With $1,000,000 in savings, the chart says that annuitizing half or more might be defensible. Smetters offered similar advice when interviewed by the New York Times. Given the level of savings available to most retirees, this advice would rule out annuities for a substantial majority.

You should, of course, make your own decisions and consult your own adviser. As one way to get a second opinion, Part 2 in this series reviews another recent study that took a different perspective. It examined the decision process that retirees may be using, perhaps unwisely, when they avoid annuities. You can also find a step-by-step process for evaluating annuities and insurance companies in our article on annuities for retirees, which was recently updated to incorporate ideas from this series of posts.

* To make the economic theory accessible, I am necessarily glossing over some technical details. For example, the classical model assumes that annuity buyers have no "bequest motive." They do not intend to set aside some assets to be inherited by a spouse, child, or charitable organization. To dig into the technical details on your own, you might start here and then consult the home page of Prof. Smetters.

Disclaimer: Historical data cannot guarantee future results. Although a mixture of bonds, stocks, and other investments may be safer than investing exclusively in one class of assets, diversification cannot guarantee a positive return. Losses are always possible with any investment strategy. Nothing here is intended as an endorsement, offer, or solicitation for any particular investment, security, firm, or type of insurance. You are responsible for your own investment decisions. Please read our full disclosures and Fiduciary Oath.
0 Comments

New Retirement Calculator

2/2/2016

0 Comments

 
On February 2, 2016, we released an updated and improved version of Plan to Retire, one of our calculators. Whether you are 20 or 70 or any age between, the improved calculator will enable you to test out your retirement plans. You can ...
  • See your forecasted income throughout the period between ages 60 and 70, when key dates occur for Social Security, pensions, and retirement withdrawals.
  • Test different scenarios, and see how they will affect your savings and potential income.
  • Study options for phased retirement by independently setting several key ages: when you start taking retirement benefits from Social Security, when you stop working, when a pension might start, and when you begin withdrawing from your retirement savings. You can make these dates all the same, all different, or any combination.
  • See how your retirement savings will be affected if you increase or reduce the amounts you and your employer save each year, or if you start taking withdrawals.
  • Test how investing more or less in stocks will affect the growth of your savings and the amount of your retirement income.
You can find this calculator and others on the Calculators menu, above.
0 Comments

Who's Your Fiduciary?

1/29/2016

0 Comments

 
Picture
This post is about the fiduciary duties of investment firms and advisers to represent their clients' best interests, and about the positions taken on this matter by the investment firms recently rated in our article Best Firms 2016.

In April 2015, the U.S. Department of Labor (DoL) proposed new regulations regarding conflicts of interest in retirement plans and the definition of investment advice. Among the most important objectives of the proposed regulations are to:
  • Strengthen the responsibility of retirement plans and retirement advisers to act in their clients' best interest, and
  • Extend fiduciary requirements to IRA providers and to rollovers between IRA and 401(k) plans.
The DoL solicited public comments on the proposal over the summer and held hearings in September. In December, Republicans in Congress failed in an effort to modify the omnibus spending bill with a rider that would have overridden the proposed new regulations. After reviewing the public comments, the DoL is expected to issue final standards this year.

To evaluate each firm's position on the proposal, I read their official submissions to the DoL and looked for news or commentary on the firm's website. The submissions ranged from brief to profuse, making it difficult to compare, for example, one that was limited but vaguely supportive versus another that detailed its clear support in some areas and constructive opposition in others. I've opted, therefore, to judge them by comparison to comments submitted by Alicia H. Munnell and Anthony Webb of the Center for Retirement Research at Boston College. The comments of Munnell and Webb are both strongly supportive of the DoL proposal and lucidly explained. I recommend reading them.

In the list below, I've ordered the firms from best to worst according to my own judgment of the degree to which they conformed to the Munnell-Webb analysis. I also gave a firm credit for disclosing its position on its own website, in a manner retail investors would could easily find and understand.

  1. Betterment submitted strongly supportive comments, covering certain aspects of the proposal applicable to individual investors and 401(k) plans. They fully disclosed the firm's position on their own website.
  2. Wealthfront submitted very limited comments, mainly supporting low-fee automated services for small investors. They fully disclosed the firm's position on their own website.
  3. Fidelity submitted modest comments here and here, requesting revision of some aspects of the DoL proposal, largely on grounds of compliance cost and administrative complexity, grounds that Munnell and Webb explicitly reject. Fidelity did not disclose any information about the DoL proposal or the firm's position anywhere on their retail client website.
  4. Charles Schwab submitted extensive comments here and here. They supported the intent and some specifics of the DoL proposal, and constructively offered clarifications, while conforming mostly but not fully to the main points advocated by Munnell and Webb. Schwab did not disclose any information about the DoL proposal or the firm's position anywhere on their retail client website.
  5. Vanguard submitted extensive comments here, here, and here. They responded constructively when in opposition but rejected some significant constraints favored by Munnell and Webb. Vanguard did not disclose any information about the DoL proposal or the firm's position anywhere on their retail client website.
  6. TIAA-CREF submitted very extensive comments here and some follow-on comments here, agreeing in concept with the need for clearer fiduciary standards but opposing many significant constraints favored by Munnell and Webb. TIAA-CREF posted an article about the DoL proposal on the firm's main website but disclosed no information about the firm's position.
  7. BlackRock submitted extensive comments here. They objected to the DoL proposal, including many significant constraints favored by Munnell and Webb, yet they allowed a generally favorable blog-post on the website of their subsidiary, Future Advisor, in conflict with the parent firm's strongly opposing comments to the DoL.

A full appreciation of the proposed standard requires some willingness to delve into legal and financial technicalities. That said, if you want to learn more, here are some ways to get started:
  • Pensions & Investments, a publication for executives who manage pension accounts and institutional investments, reviewed the DoL proposal in August 2015, explaining who's a supporter, who's not, and why.
  • The Board of Certified Financial Planners and the Financial Planning Coalition have articulated their reasons for being strong supporters. 
  • A complete list of the public comments is published on the DoL website. Using control-F in your browser, you can search for the comments of a particular firm or individual.

Disclaimer: Nothing here is intended as an endorsement or solicitation of any security or product from any particular firm or financial adviser. Please read our full disclosures.

0 Comments

Getting Smarter about Taxes

1/6/2016

0 Comments

 
Picture
Taxes are such a headache.

Still, despite the pain, it's dumb to be dumb about taxes on your investments.

​I've assembled a new article, Being Tax-Wise, that tries to capture the main points to consider when planning your investments, so as to make them a notch more tax-savvy.

Some of the ideas are obvious: Save for retirement in an IRA or your employer's plan. Others, not so obvious: should you have both an IRA and your employer's plan?

Some ideas may be surprising: Did you know you can be the beneficiary of a 529 college savings plan you establish for your own graduate degree, and possibly get a state-tax rebate for doing so?

And, yes, some ideas are downright convoluted: Being tax-smart about retirement spending will keep you mentally fit, if your frontal lobe is ready to be exercised.

The article closes with suggestions on where to turn for tax-advice and second-opinions. In an area like taxes, where you are the one ultimately accountable for the decisions, professional advice and second-opinions would be smart for everyone. You can find the full article on the Investing menu.

0 Comments

Near-Term and Long-Term Portfolios

12/18/2015

0 Comments

 
Picture
Are you investing for the near-term or the long-term? Do you have some immediate financial goals, perhaps supporting a child who's in college, plus some future objectives, including your own retirement? A new article helps you adapt your investment portfolio to match the various time-horizons of your goals. It offers specific examples and links them to our Best-Invest calculator. The full article, How Long?, is on the Portfolios menu.
0 Comments

Basic Portfolios

12/6/2015

0 Comments

 
The best and most popular news-posts at able2pay.com are being updated and moved. To see what's available, click on Retirement or on the Goals, Investing, or Portfolios menus at the top of this page. Included under Portfolios is an article on Basic Portfolios that amplifies the post immediately below.

Picture
Do you want  guidance on funds to buy in your 401(k), 403(b) or IRA, college-savings, or investment account? Here's an easy method from able2pay.com.
  • Answer two questions to set targets for stocks and bonds, suitable for your goals and preferences.
  • Allocate to three basic funds, which any firm will offer.

Step 1. Set a target percentage for stock funds.
When do you expect to spend most or all of the investments in this account?
  • All in the next year or two: Set final target = 0% and stop (skip the next question).
  • Most or all within five years: Set preliminary target = 30% and continue.
  • Six or more years from now: Set preliminary target = 60% and continue.
What is more important to you, maximizing gains or minimizing losses?
  • Maximize gains: Add 15% to your target.
  • Minimize losses: Subtract 15% from your target.
  • Do both: Keep your preliminary target (no change).
You now have a target of 0%, 15%, 30%, 45%, 60% or 75%. This is the amount you will allocate to stock funds. The rest will go to bond funds. (If you want more finely tuned values, you can get them with our Best-Invest calculator.)

Step 2. Allocate to suitable stock and bond funds.
Use your target to find the matching row in the table below. Then use the percentages in your row to invest in the funds shown by the column headings. Most 401(k), 403(b), IRA, college-savings, and investment accounts will offer these funds or equivalents. Below the table are descriptions that will help you find the right ones for your account.

Target US Stocks International Stocks Intermediate Bonds Short-Term Bonds
75 % 50 % 25 % 25 % 0 %
60 % 40 % 20 % 40 % 0 %
45 % 30 % 15 % 55 % 0 %
30 % 30 % 0 % 40 % 30 %
15 % 15 % 0 % 25 % 60 %
0 % 0 % 0 % 0 % 100 %
  • U.S. Stocks: Use an index fund that invests in the total U.S. stock market. If not available, use an index fund of large-cap U.S. stocks or the S&P 500. Avoid anything that's not indexed or that's more specific.
  • International Stocks: Use an index fund that invests in all non-U.S. stock markets. If not available, use an index fund of EAFE stocks (developed countries outside the U.S.). Avoid anything that's not indexed or that's more specific.
  • Intermediate Bonds: Use a bond fund that invests primarily in a broad mix of U.S. treasury and corporate bonds. Avoid funds with a limited focus on TIPS or on inflation-linked, international, high-yield, or short-term bonds. In a 401(k), 403(b), or IRA account, you should also avoid municipal bonds.
  • Short-Term Bonds: Use a fund of U.S. treasury bonds with maturities less than five years. If not available, use instead a short-term bond index fund or a money-market fund.

Optional Step for IRA and Taxable Accounts
The following options are good improvements for an IRA or taxable account, but are unlikely to be available for your 401(k), 403(b), or college-savings plan:
  • Invest at Betterment, and simply use the target from Step 1. Betterment's automated service will invest in a well-designed set of U.S. and international stocks and bonds.
  • Invest  at Vanguard, using the alternate table below and these funds: Global Minimum Volatility; either Mid-Cap Value Index or Strategic Equity; Intermediate-Term Bond Index; and Short-Term Treasury.
  • Invest in a low-fee brokerage account such as Fidelity or TD Ameritrade, using the alternate table below and these Exchange-Traded Funds (ETFs): iShares MSCI All-Country World Minimum Volatility (ACWV), Vanguard Mid-Cap Value (VOE) or equivalent; Vanguard Intermediate-Term Bond (BIV) or equivalent; Vanguard Short-Term Government Bond (VGSH) or equivalent.
To learn more about global low-volatility stocks, mid-to-small value-stocks, and Betterment's portfolio, see the article Diversify! on the Portfolios menu.
Target Global Low Volatility Mid & Small Value Intermediate Bonds Short-Term Treasury
75 % 50 % 25 % 25 % 0 %
60 % 40 % 20 % 40 % 0 %
45 % 30 % 15 % 55 % 0 %
30 % 30 % 0 % 40 % 30 %
15 % 15 % 0 % 25 % 60 %
0 % 0 % 0 % 0 % 100 %
0 Comments

Retired Now: Estimating Reserves

11/23/2015

0 Comments

 
Part of a series on retirement, this post explains how to use our calculator, Retiree Reserves. For other articles in the series, visit the Retirement tab. 

FAQs

Who should use the Retiree Reserves calculator? It is mainly intended for people who are retired or expect to retire in a year or two. However, you may also find it helpful if you are in your late 50's or early 60's and are considering whether to buy long-term care insurance.

What does the calculator do? It generates average and high-end estimates of the dollar value to hold on reserve for potential future expenses during retirement. These are potentially large expenses not included in your normal budget. In addition, the calculator recommends how to invest your reserve funds. All the calculator's estimates and recommendations take into account the life expectancy for your age and gender.

What potential expenses will the calculator estimate? Three types of expenses are covered: health care other than insurance premiums, long-term care services, and unusual housing expenses such as major home repairs.

How does the calculator estimate these unknowable costs? It uses data from various public sources on your expected longevity; on the expenditures of people over 65 years of age for medical costs, long-term care services, and household maintenance; and on home prices. If you own a home, condo, or coop, the calculator uses your home's value as input for the estimates. Optionally, the calculator allows you to personalize some inputs, such as long-term care in your area, if you wish.

What if you rent your home or apartment? In that case, the calculator will omit housing maintenance from your estimated reserve fund, since rent is part of your normal budget.

How does the calculator handle long-term care? The average estimate is based on government data regarding the amount actually paid for long-term care by people age 65 and older. The high-end estimate assumes two years of a private room in a nursing home, at rates based on a recent, nationwide survey (or a rate you specify).

Tips

  1. You can force the calculator to omit uninsured medical costs from the estimates by entering 0 in question 3, which asks about such costs. This will eliminate them from the high-end estimate.
  2. Similarly, you can force the calculator to omit long-term care from the high-end estimate by entering 0 in question 4, which asks about your preferred expense-level for long-term care.
  3. If you own a home, condo, or coop, but want to exclude major housing expenses from the estimate, answer "No" to question 6, which asks whether you are an owner or renter.
  4. Try running the calculator with different inputs, to see how your need for reserve funds would be impacted.
0 Comments

Retired Now: Medical Reserves

11/13/2015

0 Comments

 
This post was part of a series which is now located on the Retirement tab. The series covers:
  • The finances of Rachel, a hypothetical retiree, and the decisions she had to make.
  • Key goals for any retiree.
  • How to estimate a retirement budget.
  • Home equity as a retirement asset. 
  • A reserve fund during retirement, mostly for medical expenses.
  • Annuities that do (or don't) make sense for retirees.
  • Managing income and payouts from your retirement savings.

Why a Reserve Fund?

Some economists argue that during retirement, you should be "dis-saving," by which they mean spending down your assets, not holding reserves or saving for the future. They might also argue that "mental accounting" is irrational. From the standpoint of objective financial analysis, they would say your decisions can go awry if you mentally set aside certain funds to be spent only for certain purposes. Money is fungible, they point out. It can be used for any purpose, so spend it where you need to, constrained only by a goal to maintain a stable standard of living.

While in principle one might agree with these notions, in practice most of us do otherwise. We feel safer if something is set aside to cover the unexpected. Whether it's called a reserve fund, an emergency fund, or a sheltered account, it's a safety cushion whose purpose is as much psychological (for peace of mind) as financial (for budget planning).

Because the fund's objective is to pay for the unexpected, it is really a form of self-insurance. During your working years, a reserve fund mainly offers protection against losing your job. Thus, it's unemployment insurance that you devise for yourself and your family. During retirement, the main risk of unplanned expenses is for health care not covered by Medicare or other insurance. To a lesser extent, there may also be risks of occasional large expenses for a home you own, if not covered by your home-owner's insurance.

To plan a reserve fund for your retirement, ask yourself three questions:
  • What potential expenses should you self-insure with a reserve fund?
  • What amount should you reserve to cover those expenses for your unique circumstances?
  • Where should you hold and invest your reserve fund?
For worked examples that illustrate how to answer these questions, click here to go to the full article.
0 Comments

Better COLA for Retirees

11/3/2015

0 Comments

 
This post is the second of three on inflation during retirement:
  1. Cost of living adjustment (COLA). Analysis of the 0% COLA for Social Security in 2015.
  2. Better ways to measure what this year's inflation really was (this post).
  3. Predicting inflation next year, to better forecast your budget.

Some History

The Social Security Administration (SSA) began making annual cost-of-living adjustments (COLA) in 1975. They compute the COLA value in the early fall from three recent months of data on the Consumer Price Index (CPI).

Should those three months happen to witness a large but temporary gain or drop in consumer prices, the SSA COLA would affect payments for a full year, starting in January, as if the temporary event had been long-lasting. In 1986, for example, the prices of oil and gas were plunging when the COLA was computed. In 1987, although energy prices stabilized and inflation quickly returned to its previous level, retirees were stuck for the full year with SSA benefits set at a lower level because of the earlier, temporary downdraft. Of course, it can work the other way, too. A temporary uptick in the CPI when the COLA is computed can give retirees a nice benefits for 12 sweet months the next year.

There are better alternatives. But they are not the ones most often cited by commentators, which were covered in the first post in this series. Have a look at the chart below. It shows the SSA COLAs since 1975 (green dots), the full CPI-U index (blue line), and two alternatives for computing COLAs.*
Picture
Before considering the alternatives, compare the SSA COLA to the actual CPI-U. In 1980 and 2006, the SSA COLA was well above the CPI-U level, giving a nice boost to retiree's budgets the following year. In 1986 and 2010, both the SSA COLA and the CPI-U were low, but the CPI-U bounced back the following year to a normal level of inflation. Yet retirees had to budget for the previous year's low COLA of 1% or less.

Two Alternatives

The SSA COLA and CPI-U both vary from year-to-year to a visibly greater extent than the two alternatives, shown by the yellow and red lines on the chart. What are these alternatives, and what makes them different?
  • Core is a measure that's been computed for decades as an alternative to the full CPI-U. It uses the same data, but leaves out Food and Energy. If domestic gas, home heating oil, or imported food should rise of fall temporarily, the full CPI-U will follow along, but the "core" inflation index won't. Wait a minute! Don't retirees have gas stoves, drive cars or take buses that use gasoline, and buy foods that may have volatile prices? Of course they do. That's why the CPI-E index ("E" is for "elderly") includes Food and Energy, in portions calibrated to the spending habits of older households. But because it includes them, the CPI-E has the same flaw evident in the chart for the SSA COLA. Any index the includes Energy is prone to the boom-and-bust cycle of the gas and oil business. Possibly, some Foods have the same failing, especially if they are imported and subject to foreign currency rates. Omitting Food and Energy from an inflation index simply removes troublesome volatility.
  • Trimmed is another measure derived from the CPI-U. Like the Core index, it omits certain items from the calculation. Of the 40-plus items in the CPI-U, the "trimmed" index omits the 3 or 4 that showed the highest inflation in a given month, and the 3 or 4 that had the lowest inflation. If gasoline prices surged or collapsed in a given month, they are omitted. The same goes for utility bills or medical services or food away from home or any other component of CPI-U. The method is agnostic, however, about what to drop. Unlike the core inflation index, which always drops the same items, the trimmed index zeroes in on the current offenders, whatever they may be.
Both the core index and the trimmed index are available from the Federal Reserve Bank, going back 30 years or more. More recently, some have advocated a related index, the median CPI, which simply finds the component of the CPI that's right in the middle in a given month, at a level of inflation that exceeds half the components and is itself exceeded by the other half. 

Some Evidence

To see how the core and trimmed indexes are better, consider the statistics in the chart below. It shows that over the 33 years since 1983, when both indexes were available, they had long-run averages similar to those of CPI-U and SSA COLA. Thus, neither the core index nor the trimmed index would have given a retiree more or less over the long run, than would have been generated by the full CPI-U or the standard SSA COLA. If the trimmed or core index gave more in a particular year, they tended to give correspondingly less in another year. The compound rate of the core index was virtually identical to the SSA COLA, while the trimmed index was about 0.1% higher. The median or middle rate over the 33-year span was virtually the same for the trimmed rate as for the SSA COLA.
Picture
Look next at the standard deviation, a measure of volatility. The trimmed and core indexes had less volatility than the SSA COLA and the CPI-U. This is statistical evidence of the pattern visible in the historical chart, where the path over time was smoother for the trimmed and core indexes.

The smoothness of the two alternative measures is important for another reason. It makes the trend of cost-of-living adjustments more predictable for retirees. This year's COLA is more like next year's inflation. In the historical chart, the 0% SSA COLAs in 2009, 2010, and 2015 would have been small but non-zero values, had the trimmed or core index been used. Conversely, the spike to nearly 6% for the SSA COLA in 2008 would have been a more normal value between 2% and 4% with the other two indexes.
Picture
The final chart, shown above, provides statistical evidence that the two indexes were more predictable. Both the CPI-U and SSA COLA were utterly unable to predict next year's inflation. Their correlation was virtually zero, both with their own value in the following year, and with the future value of the full CPI-U. In contrast, the core and trimmed indexes in a given year were highly correlated with their own value the following year (r > 0.7). They were even somewhat correlated with next year's CPI-U (r > 0.3).

What Really Matters

As noted in the first post in this series, it doesn't help retirees to ask SSA to compute an index that simply weights all the normal components differently, whether in a way that matches the spending patterns of older individuals (CPI-E) or by a method that focuses on supposedly necessary but volatile expenses. What really matters to retirees is to have a method that offers reassurance on questions like these:
  • Will I be able to live within my budget next year?
  • Will my COLA this year be like it was last year?
  • Over my retirement years, will my SSA benefits truly keep up with inflation?
Because an index that removes volatile components is both predictable in the near-term and aligned with inflation in the long-run, it is superior in addressing these concerns. This is the direction SSA should take in revising their COLA calculations.

* For CPI-U and Core inflation, the plotted value is a compounded annual rate of change. First, for a given month, the non-seasonally-adjusted value is divided by the same value a year ago. This value is then compounded for the months of July, August, and September, to approximate the three-month method used for SSA COLA. For Trimmed inflation, the plotted value is compounded in September over the preceding 12-month period, using the seasonally adjusted monthly values of the 16% Trimmed Mean CPI as calculated by the Federal Reserve Bank of Cleveland. In effect, all three measures are doubly smoothed. The CPI-U and Core measures first smooth out seasonal effects by comparing the non-adjusted, current month to a year ago, then smooth again by compounding over three months. The Trimmed value first smooths out seasonality by averaging the seasonal adjustments on each expense category within a given month, then smooths over the full year by compounding 12 months of rates. Although the methods are somewhat different, the Core and Trimmed values end up having very similar volatility.

Data sources: FRED for CPI-U, Core CPI-U Less Food and Energy, and 16% Trimmed Mean CPI. Social Security Administration for its annual COLA values.
0 Comments

Retired Now: Your Home

10/27/2015

 
This post was part of a series which is now located on the Retirement tab. The series covers:
  • The finances of Rachel, a hypothetical retiree, and the decisions she had to make.
  • Key goals for any retiree.
  • How to estimate a retirement budget.
  • Home equity as a retirement asset. 
  • A reserve fund during retirement, mostly for medical expenses.
  • Annuities that do (or don't) make sense for retirees.
  • Managing income and payouts from your retirement savings.

Housing for Retirees

Housing is the single largest expense for retirees. According to the U.S. Labor Department's 2014 survey of consumer expenditures, housing is 34% of all expenses for households whose "reference person" is 65 years of age or older. That's more than double the portions for the next-highest categories of food, transportation, and medical care. They each account for 12% to 16%.

Of the 34% spent on housing for those over 65, the biggest share (18.5%) goes to the cost of shelter, which includes mortgages, rent, repairs, maintenance, and property taxes. Next come utilities (8.6%), including electricity, gas, telephone, water, and heating oil. Other expenses, such household furnishings, upkeep, supplies, and services, are the smallest portion (5.8%).

Is renting or owning better for a retiree? What about a reverse mortgage, or using home equity as a reserve fund, or leaving your home as an inheritance? For more on these matters, click here to go to the full article.

Retired Now: Rachel's Decisions

10/22/2015

 
This post was part of a series which is now located on the Retirement tab. The series covers:
  • The finances of Rachel, a hypothetical retiree, and the decisions she had to make.
  • Key goals for any retiree.
  • How to estimate a retirement budget.
  • Home equity as a retirement asset. 
  • A reserve fund during retirement, mostly for medical expenses.
  • Annuities that do (or don't) make sense for retirees.
  • Managing income and payouts from your retirement savings.

Decision Time

As a recent retiree and a new widow, Rachel had lots of questions. She wasn't expecting her brother Billy to be much help. To be sure, he would have some advice. How much she could trust his self-professed expertise was another matter. Realizing the decisions were going to be hers in the end, Rachel had done her own homework before seeking a second opinion from Mr. Over-Confidence.

"Billy, I think I have to change something."

"Yeah, I knew that. Let me tell you about what I've done with my IRA."

"It's not your IRA I'm worried about," said Rachel, suspecting that Billy's retirement plans might actually benefit from oversight by someone other than himself. But she wasn't going to go there, not today.

"I've got too much cash in my bank account," Rachel continued. "There's the $100,000 payout from Isaac's life insurance, plus the $20,000 we had saved ... " Her voice trailed off as she remembered how they had planned to spend their golden years, before the accident swept Isaac out of her life forever ...

Click here to read Rachel's full story.

Retired Now: Round Numbers

10/20/2015

 
This post was part of a series which is now located on the Retirement tab. The series covers:
  • The finances of Rachel, a hypothetical retiree, and the decisions she had to make.
  • Key goals for any retiree.
  • How to estimate a retirement budget.
  • Home equity as a retirement asset. 
  • A reserve fund during retirement, mostly for medical expenses.
  • Annuities that do (or don't) make sense for retirees.
  • Managing income and payouts from your retirement savings.

A Rough Budget

To get a rough budget, you'll need to estimate your overall expenses, your sources of income, and how long you need your income to last. The method outlined here is meant to be a first step, an approximation. It will help you judge whether your income may enable you to reach your main goals. It won't answer every question, down to the last dollar. But it's a good start.

Here's an overview of the method, step-by-step. It has five "round numbers" that are close enough for a rough budget.
  1. Find Life+6, your life expectancy plus an extra cushion of six years.
  2. Use tax returns and account statements from last year, plus the inflation rate for the past 12 months, to estimate your annual expenses this year. This number is what you actually spent last year, including tax payments, but excluding income you saved, all adjusted for current inflation.
  3. Find your stable income from Social Security, pensions, income annuities, and reliable work, also adjusted for current inflation. Life+6 plays a part in calculating this number.
  4. If your stable income won't cover your annual expenses, find your spending balance. This is the amount available to extract from your spending account. As detailed in Enable Your Accounts, a spending account is a temporary reserve where you manage one or two years of living expenses.
  5. If your annual expenses are still not met, calculate the safe payout you can take from your retirement accounts and taxable savings. With Life+6, there's a simple, reasonable way to do this calculation. (Our Safe-Payout calculator does it for you, and offers other options, as well.)
Should you be over 70 years and 6 months of age, and required by the IRS to take minimum distributions from your retirement accounts, these would go to your spending account in step 4, if needed, and next to your safe payout or taxable savings in step 5.

For worked examples of each step, click here to read the full article.

Cost of Living When Retired

10/18/2015

 
This post is the first of three on inflation during retirement:
  1. Cost of living adjustment (COLA). Analysis of the 0% COLA for Social Security in 2015 (this post).
  2. Better ways to measure what this year's inflation really was.
  3. Predicting inflation next year, to better forecast your budget.

On October 15, the Social Security Administration (SSA) announced that there would be no cost-of-living adjustment (COLA) in 2016. Retirees, their dependents, and people on disability will receive the same monthly benefits in 2016 as they did in 2015. Some commentators have responded that real inflation for retirees and the disabled was greater than SSA estimated, and there should have been an increase in benefits. Who's right?

The answer hinges on how inflation is calculated. Let's consider these options:
  • CPI-U is the Consumer Price Index for All Urban Consumers. First introduced in 1978, it is estimated to cover the expenses of 80% of American households.
  • CPI-W is the Consumer Price Index for Urban Wage Earners and Clerical Workers. Based on the original inflation index developed by the U.S. government in 1918, it is estimated to cover 32% of American households.
  • CPI-E is the Consumer Price Index - Elderly. An unpublished, experimental value, it estimates the spending of households whose "reference person" (or their spouse) is 62 years of age or older, regardless of whether they are employed or retired. It covers about 24% of U.S. households.
  • CPI for Basic Necessities. Also an unpublished, experimental value, this index covers the costs of food-at-home, shelter, apparel, energy, and medical care. It applies to the same 80% of households as CPI-U, but eliminates categories such as eating out, entertainment, and other expenses considered to be non-essential.
The SSA uses CPI-W, which estimates inflation for wage-earners, even though SSA's beneficiaries are, to a large extent, not wage-earners. CPI-W actually decreased from 2014-2015, but SSA's rules prevented them from decreasing benefits. Thus the benefits were held flat.

CPI-U, one might argue, is a broader measure that includes non-wage earners, and might therefore be a better measure of inflation for retirees and those receiving disability benefits. But CPI-U also fell slightly from late 2014 to late 2015. Here, too, SSA's rules would have required the benefits to remain unchanged.

CPI-E would seem appropriate for retirees, but not necessarily for Social Security recipients younger than 62, such as widows, those on disability, and dependent children. An old, possibly outdated comparison of CPI-E and CPI-W found that CPI-E was about 0.3% higher than CPI-W, mainly because of higher expense for health care among the elderly. Applying 0.3% as an adjustment to SSA's calculations, the inflation rate would have been just under zero (-0.01%). Furthermore, in more recent data for the period 2002-2015, CPI-E has averaged the same as CPI-W. Either way, with newer or older data, CPI-E would not generate an increase in SSA benefits this year.

Finally, CPI for Basic Necessities would seem appropriate for retirees whose goal is to guarantee a "floor" budget for essentials, while allowing a flexible "ceiling" budget for discretionary items. Comparison of this index against CPI-W for the past 30 years indicates that CPI-W under-estimates inflation in basic necessities by about 0.26% per year. However, even after adjusting for the 30-year difference, the current inflation rate would still be less than zero. And it remains zero when CPI for Basic Necessities is compared for September 2015 versus September 2014.

The bottom line? No matter which measure of inflation you prefer, all of them estimate a slight decline in consumer prices for retirees, between late 2014 and 2015. Thus the decision is whether to cut benefits or leave them flat. Viewed in that light, SSA's announcement of no COLA may be more palatable.

​The real concern? If overall inflation is not a valid concern, what is? I suspect two legitimate issues may be on people's minds.
  • First, if you don't drive a car, then your personal inflation rate is probably higher than average, perhaps between 1% and 2%, because you are not getting the full advantage of declining gas prices. You may be seeing only a small decline in utility bills or some modest savings on airfares or other transportation.
  • Second, you may be concerned about the predictability of your budget. For example, looking ahead to housing and health care costs next year, you may expect them to rise. If they do, this year's 0% COLA means you will have to bear the additional costs for 12 months, until SSA calculates the next COLA in October 2016.
​Addressing these concerns, the follow-up post in this series examines other ways to calculate inflation for retirees, and recommends how to make cost-of-living adjustments more stable and predictable.

Retired Now: Rachel's Story

10/14/2015

 
This post was part of a series which is now located on the Retirement tab. The series covers:
  • The finances of Rachel, a hypothetical retiree, and the decisions she had to make.
  • Key goals for any retiree.
  • How to estimate a retirement budget.
  • Home equity as a retirement asset. 
  • A reserve fund during retirement, mostly for medical expenses.
  • Annuities that do (or don't) make sense for retirees.
  • Managing income and payouts from your retirement savings.

The Plan

They had it all planned. Isaac would keep working until age 70, while Rachel, who left her job a few years ago, would work on her hobby, making jewelry. Once both were retired, they might tend the backyard garden properly for the first time in years and enjoy each other's company on road trips. Not long ones, though. They loved where they lived and had favorite day-trips and hiking trails they intended to re-visit as often as they liked.

When he was 66, Isaac had filed and suspended his Social Security benefits, which he planned to start at the latest possible date, after his 70th birthday. He liked his job and knew that delaying Social Security would increase his eventual benefit by 8% for each year he waited. Besides, his income from working would more than meet their needs. He could even afford to save some, which he did, in his employer's 401(k) plan. For insurance, he had a low-cost term-life policy that would pay about two years of his pre-tax income. It was due to expire when he turned 71.

Rachel, on the other hand, had recently started her own Social Security payments, soon after she qualified for full benefits. They were less than Isaac's payments would be, but she had decided to quit a job that bored her and get started on her crafts. For years, she had dreamed of using her artistic talents to make jewelry, and, without the pressure of working every day, she had a chance to begin. Her modest payments from Social Security helped her set up a studio in their home. Maybe, if all went well, she would one day be able to sell her jewelry at local craft fairs ...

To learn more about why Rachel's and Isaac's plans had to change, click here to read the full story.

Annuity Examples, Good and Bad

6/25/2015

 
An annuity that gives you guaranteed payments, for the rest of your life, may seem attractive. But it likely comes with fees and restrictions that may be hard to decipher. Furthermore, the net benefit to you may be less than you think, and more expensive than other options. Still, for some, certain annuities make sense. The key questions are:
  • What's an annuity, and do you need one?
  • How can you find the best annuities from the best companies?
  • What annuities should be avoided, because better alternatives are available?
For answers, click here to read our article on annuities, which is located on the Retirement tab. Or, for detailed examples based on our research, continue reading the post below.

Worked Examples

Here are some examples of Single-Premium Immediate Annuities (SPIAs) and other options. They are based on actual quotes and real products, for a hypothetical married couple in their late 60's, seeking to invest $100,000 from an existing retirement account, with 100% benefits to be paid as long as either spouse lives. Although the quotes and products are genuine, I've made the companies anonymous because they may not operate in the state where you live, your age and other variables may differ, and the companies may impose contractual stipulations that depart from the quotes and website-data available to me. These examples should not be construed as recommendations to buy any particular security or insurance product. Rather, they are intended to illustrate how you might examine and evaluate annuity options applicable in your circumstances.
  • SPIA-3%. This immediate income annuity raises its payments by 3% each year. The first year's payment is $4544, a 4.54% rate on the $100,000 deposit. With a COMDEX rank of 96, the insurer is among the top 30.
  • SPIA-CPI. Also an immediate income annuity, this one increases its payments by the same percentage as the previous year's increase in the Consumer Price Index. Its first year payment is $4349, or 4.34%. The insurance company's COMDEX rank is 90, which puts it solidly in the top 100.
  • Rider. This variable annuity is a partnership between a well established, highly regarded investment firm and an insurance company with a COMDEX rank of 92 (the top 60). Underlying the annuity is a mutual fund invested 60% in domestic and international stocks, and 40% in domestic and international bonds. The mutual fund, if purchased by itself, would have fees under 0.2%. Purchased as a variable annuity, it has additional fees of 0.29%. A guaranteed income rider adds 1.2% more. The total fees are pro-rated as 0.127% deducted automatically every month. In year one, for a $100,000 purchase, the annuity pays you $4500 (4.5%). Net, every month that year, the insurer deducts $501.67 from your account, paying $375.00 to you and $126.67 to itself. These values may change, depending on the performance of the mutual fund. It's possible for the annuity fees to increase while the payments to you remain flat. On the other hand, a legal rider to the annuity contract guarantees that payments to you will never decrease, and stipulates a formula by which they will increase if the underlying investments rise above their value at the time of purchase.
  • Self-CPI. This option is not an annuity. It's a direct investment in the same mutual fund that underlies the Rider option. But the fees are lower, under $16 monthly, because none of the annuity fees apply, and the fund is held in an IRA account with no employer-related fees. It's a self-managed plan, where the investor uses the "collared inflation" method described here and implemented in our retirement income calculator. This method starts with an initial payment of $4020 (4.02%) because of the age of the hypothetical couple. It increases the payment each year by the smaller of (a) 6.7% or (b) last year's change in the Consumer Price Index. The limit of 6.7% is a "collar" which, historically, has been necessary to protect against depleting the fund in the worst case of 40+ years in retirement with inflation initially at extreme levels.
I was able to obtain market data since 1972 for the domestic stock, international stock, and domestic bond indices underlying the Rider and Self-CPI options (but not for the international bond index, which was added to the mutual fund only very recently). This data was used to simulate what would have happened if an investor had begun each of the options above under three scenarios:
  • From January 1972 to December 2014, a 43-year retirement with wide variation in markets and inflation.
  • A 21-year retirement starting in 1973, when stocks crashed then rose, and inflation started very high.
  • A 21-year retirement starting in 1994, when stocks and bonds both rose and fell, but inflation was low.
The simulations are necessarily conjectures. The annuities being simulated were not available to be purchased during these time-periods, and had they been, their prices, interest rates, and contractual terms might have been different from what is sold today. Thus, the analyses reported below must be viewed as suppositions about what might happen if today's annuity products were to experience future markets for stocks, bonds, and interest rates resembling markets of the past.

Retired 43 Years, 1972-2014

Picture
First, the good news. All four options provided payments every year for 43 years. Even better, the Self-CPI option had a residual value of $209,650, adjusted for inflation, in 2014. Yes, you read that right. With the money left in 2014, the investor's heirs would have had twice the buying power of the couple's original $100,00 investment in 1972. The annuities, as annuities, had no residual value. Instead, any profits went to the insurers.

However, because 43 years is a long time, because inflation was high in the 1970's, and because the period included multiple large swings in the values of stocks and bonds, the four options paid out very different amounts from year to year. The chart below shows how they differed, over time. It's important to note that in the chart, all values are inflation-adjusted to show constant buying power, pegged to January 1972.
Viewed in terms of buying power, the SPIA-CPI option was the clear winner. When adjusting for last year's inflation, it sometimes lost a bit of buying power if current-year inflation was high. But over the long term, it guaranteed constant income, in real, inflation-adjusted dollars. 

The SPIA-3% option underestimated the high inflation of the 1970's and never caught up. Had this annuity been purchased with a 4% annual increase instead of 3%, the initial payment would have been a bit smaller, but the decline during high inflation would have been more limited. Eventually the initial buying power would have been nearly restored, as the compound rate of inflation for the entire 43-year period was 4.14%.

The Self-CPI option, because of its 6.7% cap on annual increases, fell behind inflation in the 1970's, but leveled out from 1980 onward. In effect, this method made a trade-off. It kept a large bequest as a result of cautious withdrawals.

The Rider option, when adjusted for inflation, fell short on its promise that payments would never decrease. Yes, in nominal dollars, the same amount was paid every year throughout the 1970's, but within a decade, inflation cut the buying power of those dollars in half. When huge bull markets in stocks and bonds began in 1982, the Rider option swiftly recovered, only to lose ground again after the dot-com bubble burst in 2000. Of all four options, this one had the least consistent payouts, adjusted for inflation.

Two 21-Year Retirements

The foregoing analysis comes with a big caveat. It's for a very long retirement in a unique historical period. Your experience in retirement will almost certainly be different. Consider, then, two other examples, both 21 years in length, one from January 1973 to December 1993; the other, from January 1994 to December 2014.

During these two periods, the underlying mutual fund of the Rider and Self-CPI options had compound, inflation-adjusted returns a bit higher than 5% per year. In this respect, the stock and bond markets were, overall, about average during both periods, despite some dramatic swings along the way.

At 21 years, both periods were also average in another sense. They fit the joint life-expectancy of a couple in their late 60's.

A key difference, however, is that in the first period, 1973-1993, inflation was abnormally high (6.05%), while in the second, 1994-2014, inflation was much lower (2.30%). Because of inflation, the SPIA-CPI option did the best job of maintaining payments at constant buying power in the 1973-1993 period; the other methods lost about 25%, falling close to $3000, inflation-adjusted. In the low-inflation period from 1994 to 2014, however, all the options preserved buying power, and the SPIA-3% and Rider payments actually bettered inflation. The chart below displays the average payments, after adjusting for inflation.
Picture
As shown in the next chart, only SPIA-CPI generated annual increases that kept pace with the 6% rate of inflation in the first period, while all the options matched or beat the tame 2.3% rate of inflation in the second period.
Picture
Finally, as with the 43-year analysis, the Self-CPI option was unique in preserving a bequest. Adjusted for inflation to reflect constant buying power, Self-CPI preserved principal approximately equal to the initial investment, in both 21-year periods: $90,756 at the end of 1972-1993, and $144,631 at the end of 1994-2014. The three annuities, by design, left nothing.

Summing Up

The examples presented here are for selected options and time periods. As such, they cannot be taken as guarantees of future performance or as definitive recommendations of certain products. Your results may differ, and will, as with any investment, entail a risk of loss. With those important cautions in mind, consider the following key insights from these examples:
  • If one's goal were to guarantee constant buying power, SPIA-CPI would have been the best of the options examined above. A SPIA with a 4% or 5% annual increase might have performed comparably for periods of high inflation, but would have been more than necessary under normal levels of inflation.
  • If one's goals were to preserve constant buying power and also leave a bequest, Self-CPI would have been the best of the options studied here. However, it would require active management by the investor (or by a paid adviser), which sets it apart from the annuity options.

Payouts: Smoother Is Better

5/8/2015

 
This post was part of a series about managing how you spend your investments, if you aim to live long, live within your means, and, perhaps, leave some for others. The main ideas have been updated and moved to an article on Retirement Income, on the Retired Now menu. If you wish, you can still read the original series, using the links below.
  • Retail strategies, using all-in-one mutual funds. Simple solutions that work for some.
  • Insurance strategies, using Social Security and maybe some annuities. Part of everyone's plan.
  • Endowment strategies, adapted from foundations and universities. Good for a reserve fund.
  • Finance strategies, based on life-expectancy and future payments. Really good, simple methods.
  • Smooth consumption, a comprehensive method that uses excellent, free software. This post.

Wandering

Imagine yourself as the following investor. 

It's several years before you plan to retire. Looking back on your financial history, you recall your first job, first home, and first child. With some regret, you remember saving a pittance of your first salary toward retirement. You barely managed the down-payment on your starter home, and struggled to pay unplanned expenses for repairs and property taxes. And that new baby! You were so much in love with the darling that you foresaw few of the looming costs of pre-school care and future education, not to mention that all the kiddie-transport, soccer uniforms, and music lessons.

Now looking ahead to retirement, you've got some savings but aren't sure if it's enough. You think you might downsize your domicile but don't know how much it will boost your future income, or for how long. You dimly foresee a different budget, with less costs for children and more for health care, but that's not much help because your current budget is (let's be kind) an approximation. Yes, but you've become more intelligent about investing because, after all, your account balances have grown over the years. Then again, you're not sure if they might have grown more if you'd invested differently. Oh! And Social Security? You're starting that when?

Does this sound familiar? Like someone you know? Maybe even like you, or the old you before you got wiser?

If so, your financial path to this point wasn't a journey you planned. It was more like a wandering through time and sometimes turmoil, with ridges, ravines, and roundabouts along the way. If only you had some good advice, you think you could do better.

Gliding

An investment firm or financial planner might offer the advice you want. Condensed into a single phrase, it will be some version of this: De-risk your glide path. Huh? Let's spell it out.
  • Know your risks. They are likely some versions of carrying too much debt, concentrating your investments in ways that are overly volatile, being under-insured for things you can't afford to lose, saving too little for known future expenses, and lacking reserves for life's unexpected turns.
  • Manage the risks. The strategies for doing so may include reducing or refinancing your current obligations, diversifying your investments according to good principles, buying the right kinds and amounts of insurance, developing a plan to invest wisely now and spend smartly in the future, and finding a safe haven for some reserves.
  • Have a glide path.  A good financial plan will acknowledge that if changes are necessary, it may take some time to implement them. You will ease into your new budget, investments, insurance policies, and financial discipline. Like a target-date fund for retirement, your financial plan will have a path that starts with the turbulent uncertainty you have now and glides to the more cautious predictability you seek.

All well and good. Just beware of two pitfalls.

First, the person generating recommendations for your plan is selling you products to achieve them. Not might be selling them, is selling them. One way or another, any investment firm or financial planner has some incentives to earn compensation, directly or indirectly, from the advice they give you. It might be a direct fee, a percentage of your assets, a sales commission, or an indirect charge in the expense-ratio of the funds they recommend. There's nothing inherently wrong with that, but buyer beware. And get a second opinion from someone with different incentives.

Second, in traditional financial planning, including typical online calculators, you set a target for your future budget. It's the destination of your financial glide path. It may be 75% of your pre-retirement spending. Or that amount with some puts and takes for expenses that vanish (like mortgage payments) and new ones that emerge (like Medicare premiums). But the target is necessarily imprecise. And it can't possibly be correct throughout an entire, decades-long retirement. Thus, in addition to getting a second opinion from an adviser with different incentives, you should get one from a different method that doesn't depend on a fallible target. Is that even possible? Read on! 

Smoothing

Consumption smoothing is a genuinely different method, and you can get it from a source with distinctly different incentives.

In consumption smoothing, the goal is not to set a target for a glide path to your retirement date. It's to find a standard of living for your household. The standard of living has to be achievable and stable. In short, the method computes how you can live within your means and live equally well throughout your lifespan. To do this computation, it gathers information about:
  • Expenses you can't avoid, like housing and taxes.
  • Your income now and in the future, whether from work, Social Security, a pension, or retirement accounts.
  • Your household's changing characteristics, allowing for factors such as the temporary costs of children in college, and the dual incomes of spouses or partners whose work histories and retirement dates may differ.
  • Your contributions to retirement and investment accounts, and to reserve funds.
  • The tax-rates where you live and the ones applicable (or not) to your Social Security benefits and Roth or other retirement withdrawals.
Given this information, and possibly more, the method calculates how much you can consume (your discretionary expenses). It uses a complex algorithm to make your consumption a smooth, constant amount throughout your lifetime, in real (inflation-adjusted) dollars. In short, rather than asking you to set a target budget for a particular date, it calculates a durable level of discretionary spending. In effect, it tells you what you can afford, not just this year, but every year going forward.

What if you don't like the answer you get from this method? Then you can adjust some of the data you give as input. By doing so, you can find out whether your lifetime standard of living would change if you saved more now. Or if you started Social Security at a different age. Or if you put more (or less) into a college savings plan and less (or more) into a reserve fund.

ESPlanner is patented software that implements this method. It was developed by two economists, Dr. Jagadeesh Gokhale and Prof. Laurence J. Kotlikoff, and is produced by Economic Security Planning, Inc. The incentives for this firm are simple: to sell you their software. The prices, however, are low, much lower than you would pay directly or indirectly to an investment firm or typical financial planner. Even better, there's a basic version that's completely free. It does a remarkably comprehensive job, and is available at basic.esplanner.com. To see how it works, you can get a nice example from this recent article by Prof. Kotlikoff.

ESPlanner won't sell you life insurance. Instead, it calculates how much life insurance you need (or don't need) and how the amount will change in the future, in order to protect your household's standard of living. It won't recommend any stocks, bonds, investment funds or bank deposits. But given your current and planned investments, it tells you the smooth, life-long standard of living they will enable you to have. It won't tell you when to take Social Security benefits or start retirement withdrawals. Experiment with possible dates, however, and it will calculate the impact on your standard of living.

A really nice feature is that each time you change the inputs, ESPlanner will generate tables showing, for every year in your anticipated life-span, the amount it calculates you will pay in taxes, the amount you should save that year, and the sources of your discretionary spending, whether from work, investment income, Social Security, retirement withdrawals, or prior years' savings. Look carefully at these tables, to see how you can stabilize your living standard by balancing what and how you save and spend over the years.

Getting started is simple. Watch two short videos at the website, then enter your data. It will take about an hour of your time, and will cost not one cent. More advanced versions will cost little and, as detailed on the website, they provide extra features you may want after trying the free version.
Disclaimer: I have personally purchased and used ESPlanner software for my own household, but receive no compensation of any kind for recommending products sold by Economic Security Planning, Inc. Before using ESPlanner, you should read the product's disclaimers and disclosures.
<<Previous

    Alex Wilkinson

    Enabling you to pay for your financial goals, and helping non-profits to thrive. Read more.

    Picture

    RSS Feed


    ​Categories

    All
    Fees
    Firms
    Inflation
    Investing
    Planning
    Retirement

(c) Able to Pay, LLC 2014-2018. All rights reserved.

Site Map

Legal

Contact

News
Retirement
   Retired Now
   Retiring Soon
   Saving to Retire
Goals
Investing
Portfolios
Calculators
    Best-Invest
    Safe Payout
    Retiree Reserves
About


Fiduciary Oath
Terms and Conditions of Use
Privacy Policy
Disclosures

contact@able2pay.com
Able to Pay, LLC
315 Riverside Dr 15A
New York, NY 10025

Proudly powered by Weebly
Photos used under Creative Commons from blhphotography, daveynin, Markus Trienke, rust.bucket, reynermedia, Seth W., MorboKat, andy.brandon50, Brett Jordan, futureatlas.com, quinn.anya
  • News
  • Retirement
    • Retired Now
    • Retiring Soon
    • Saving to Retire
  • Goals
    • Ask Yourself
    • Building Wealth
    • Investing to Buy
  • Investing
    • Basic Methods
    • Rebalancing
    • Stocks or Bonds?
    • Investment Fees
    • Best Firms 2016
    • Being Tax-Wise
    • Finding Advice
  • Portfolios
    • Basic Portfolios
    • How Long?
    • Diversify!
    • Factor Investing
    • Finding Value
  • Calculators
    • Best-Invest
    • Safe Payout
    • Retiree Reserves
    • Income Reserves
  • About
    • Why Able to Pay?
    • People