
My previous post examined ways to minimize drawdowns in a portfolio. This one turns the table to study how best to maximize returns.
Admittedly, it's not a clean dichotomy. When analyzing drawdowns but confronted with portfolios that impose similar limits on them, the urge is strong to see how the portfolios compare on returns. The same urge will sneak into the storyline here. Focusing primarily on portfolio returns, I'll admit some consideration of drawdowns if the returns are not decisive.
Admittedly, it's not a clean dichotomy. When analyzing drawdowns but confronted with portfolios that impose similar limits on them, the urge is strong to see how the portfolios compare on returns. The same urge will sneak into the storyline here. Focusing primarily on portfolio returns, I'll admit some consideration of drawdowns if the returns are not decisive.
100 Years of Large-Cap Stocks in the U.S.
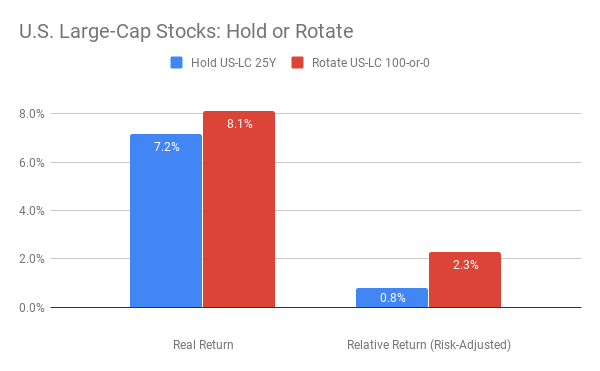
Shown in the chart above are key findings for large-cap stocks in the U.S. between April 1919 and March 2019. As I've noted previously, different 25-year segments of this period exhibited dramatically different results for investors. Yet across all the historical variations of that century, the trends captured in the chart were consistent. Looking closely, you can see three of them.
"What about rebalancing?" you might ask. Was there a portfolio that rebalanced large-cap stocks and 10-year Treasury bonds to achieve best-in-class returns? The answer for the U.S. was, "No, not with any consistency." In three of the four 25-year periods since 1919, no rebalanced portfolio outperformed one that bought and held large-caps for the duration. In one case alone, 1919 to 1944, it was a close call. Then, rebalancing 90% in stocks against 10% in Treasuries ended in a dead-heat with 100% in stocks, as both methods had real returns of 7.3% and relative returns at 4.4%.
25 Years of Large-Cap Stocks in Germany, Japan & Australia
The results in other countries, however, were sometimes different from the U.S. In a post titled Does Rotatation Work in Global Markets?, I showed recent 25-year returns in three other countries, with local large-cap stocks and local 10-year Treasuries, invested in local currencies, adjusted for local inflation. In two of the countries, Germany and Japan, Treasuries outperformed the relevant large-cap index, and in the third, Australia, they almost did.
Shown in the chart above are key findings for large-cap stocks in the U.S. between April 1919 and March 2019. As I've noted previously, different 25-year segments of this period exhibited dramatically different results for investors. Yet across all the historical variations of that century, the trends captured in the chart were consistent. Looking closely, you can see three of them.
- The pair of bars on the left show that holding a high percentage of the portfolio in large-cap stocks paid sizable real returns in the long-run. These returns are annualized and adjusted for inflation. The two portfolios represented by the bars on the left were 100% invested in stocks all or most of the time.
- On the other hand, the pair of bars on the right show that if you adjust for the risk of drawdowns, then the relative returns of these portfolios were modest. A relative return is the portfolio's surplus over investing 100% in 10-year Treasuries, after compensating for the portfolio's incremental risk of drawdowns. The risk-adjusted bars on the right show that the same stock-heavy portfolios were barely a percentage point or two better than 10-year Treasuries. For the additional risk taken, the reward was limited. (An earlier post explains how I calculate relative returns.)
- Finally, the color-contrast in the chart compares two methods of portfolio management. The blue bars show the average outcome of buying and holding large-cap stocks for a full 25-year cycle. The red bars average the same 25-year periods, but within a period, the portfolio's holdings rotate between being completely in large-cap stocks or wholly in 10-year Treasuries. The criterion for deciding whether to hold equities or Treasuries is the total return of those two assets in recent months (as explained in What Now: Sell, Rebalance, or Rotate? and in Best Options to Minimize Drawdowns). The message of the color-contrast in the chart is that rotation delivered better outcomes than buy-and-hold, because it more effectively controlled the risk of drawdowns.
"What about rebalancing?" you might ask. Was there a portfolio that rebalanced large-cap stocks and 10-year Treasury bonds to achieve best-in-class returns? The answer for the U.S. was, "No, not with any consistency." In three of the four 25-year periods since 1919, no rebalanced portfolio outperformed one that bought and held large-caps for the duration. In one case alone, 1919 to 1944, it was a close call. Then, rebalancing 90% in stocks against 10% in Treasuries ended in a dead-heat with 100% in stocks, as both methods had real returns of 7.3% and relative returns at 4.4%.
25 Years of Large-Cap Stocks in Germany, Japan & Australia
The results in other countries, however, were sometimes different from the U.S. In a post titled Does Rotatation Work in Global Markets?, I showed recent 25-year returns in three other countries, with local large-cap stocks and local 10-year Treasuries, invested in local currencies, adjusted for local inflation. In two of the countries, Germany and Japan, Treasuries outperformed the relevant large-cap index, and in the third, Australia, they almost did.
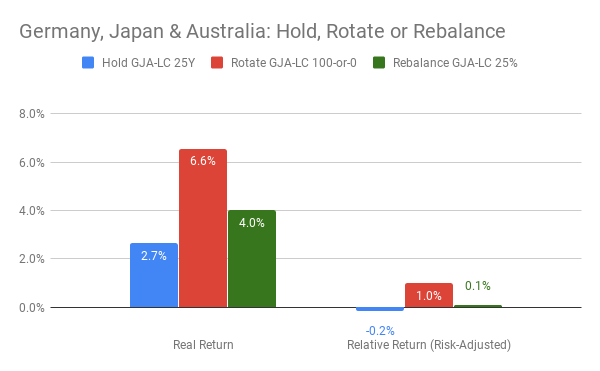
If you believe an oft-cited legend that stocks always beat bonds for holding periods longer than 20 years, this is not supposed to happen. But it did there, implying that it could here. In the unlikely event that you might foresee this outcome in advance, you could elect to rebalance a portfolio to target levels of 25% in stocks and 75% in Treasuries. As shown in the chart, doing so for Germany, Japan, and Australia between 1994 and 2019 yielded better real returns than any other rebalanced portfolio and, on average, also bested an all-stocks portfolio in those countries.
Even better results would have accrued by using the rotation strategy, placing 100% in large-caps when their recent total returns were temporarily better than local 10-year Treasuries and otherwise investing all the portfolio's assets in those Treasuries. Happily, for this strategy, you don't have to guess whether stocks or bonds will be stronger in the future. You simply adapt to whichever has been stronger in recent months.
A cautionary note, however, is that all the foregoing comments are limited to real returns. For relative returns, which adjust for the risk of drawdowns, the results were, to be blunt, pathetic. Considering the risks taken, no strategy that invested in stocks in these countries was much better, in the last quarter-century, than one that bought and held 10-year local Treasury bonds.
25 Years of Low-Volatility Stocks Worldwide
For completeness, should low-volatility stocks be considered when the goal is to maximize returns? It makes sense to consider them when trying to limit drawdowns, because by design, stocks chosen for their low volatility should, theoretically, fall less than the average equity when the stock market takes a tumble. On the upside, however, an advantage for low-volatility stocks is not obvious.
Empirically, academic research implies that such an advantage may exist (as reviewed, for example, in Andrew Ang's textbook on asset management). In the research, when equities were selected for a portfolio because their price-fluctuations were low or because they were weakly correlated with market averages, the studies reported that the portfolio's returns approximated or modestly exceeded those of the full stock market, even when it was rising.
Accordingly, the next chart summarizes results averaged across three indexes of low-volatility stocks from April 1994 to March 2019. The indexes are tracked by iShares ETFs for the U.S., for developed countries outside the U.S., and for stock-markets globally. The trading histories of the ETFs were too short for this analysis, which was based instead on the index histories in U.S. dollars and on U.S. 10-year Treasuries.
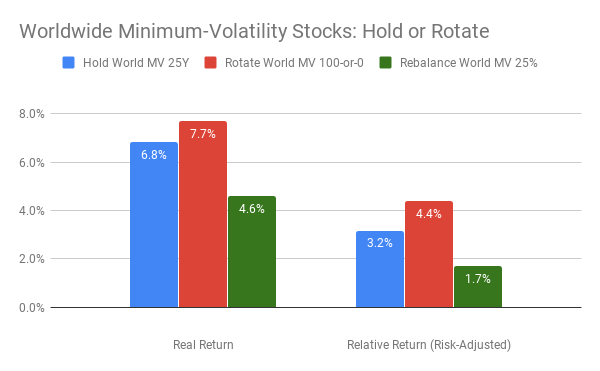
On close inspection, several aspects of this chart are noteworthy.
Key Takeaways
- First, as in the academic research, a 6.8% real return for these low-volatility indexes over the last 25 years compared favorably to the 7.2% real return of large-cap U.S. stocks over a much longer history, which was shown in the first chart in this post.
- Once again, the rotation strategy outperformed buy-and-hold.
- Perhaps surprisingly, the relative returns for these low-volatility indexes were quite good on the upside. They did double-duty, in effect, generating stock-like returns while handily limiting the risk of drawdowns.
- Rebalancing low-volatility stocks would not have been the method of choice for maximizing returns. At its best settings, rebalancing yielded just 4.6%, well below the levels attained for buy-and-hold and rotation. Furthermore, when adjusted for risk, it was unremarkable, like its counterpart in the analysis of Germany, Japan, and Australia. That said, if one's goal were to limit drawdowns with minimal effort, rebalancing 25% in low-volatility stocks against 75% in intermediate Treasuries would be attractive.
Key Takeaways
- If you aim to maximize returns, ask whether you are willing to exert the discipline and monthly effort to apply the strategy of rotation. If so, rotating well diversified, low-volatility ETFs may generate the best risk-adjusted returns. Rotating broad-market averages should also reward you for the risks taken, scoring slightly higher than low-volatility ETFs on real returns but slightly lower on risk-adjusted ones.
- Buying and holding stocks may often deliver better returns than buying and holding Treasury bonds, provided that the holding period is very long. Often. But not always! Even at 25 years, there are historical cases where long-held Treasuries have beaten long-held equities.
- Rebalancing is not optimal for maximizing returns. As a strategy, its best application may be for goals that aim to reduce drawdowns.
- A big caveat: For a goal that seeks a compromise between maximizing returns and minimizing drawdowns, the analysis in this post offers no guidance. That's coming in my next post in this series.

 RSS Feed