
On June 3, 2019, my post What Now: Sell, Rebalance, or Rotate? launched an on-going series comparing rebalanced portfolios with a new strategy of rotation. On that date, a simple version of the rotation strategy caused a portfolio invested entirely in stocks to convert all its assets to U.S. Treasuries. On the date of this post, July 1, 2019, another instance of that strategy caused a traditional portfolio of 60% stocks and 40% bonds to switch to 100% bonds. This post describes how the rotation strategy works, using these two portfolios as examples.
Different Portfolios for Different Goals
The two portfolios are alike in some ways and very different in others. Neither portfolio is always invested in stocks or always in bonds. Both do both. Neither portfolio holds a static mix of stocks and bonds. Both vary their mixture over time. One of the two holds Exchange Traded Funds (ETFs) and may switch them several times a year. The other holds traditional mutual funds and imposes controls to limit turnover. Yet both portfolios use rotation to achieve better returns and substantially lower drawdowns than traditional alternatives.
The two portfolios are suited to investors with different goals.
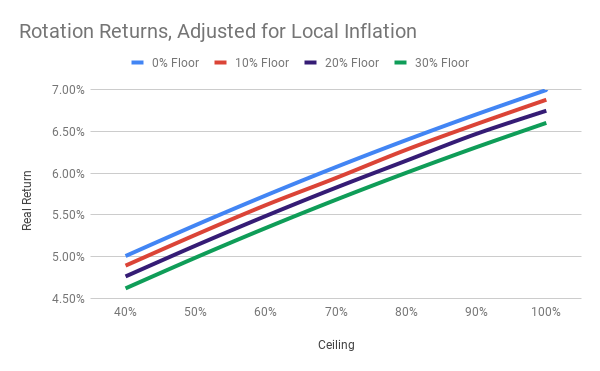
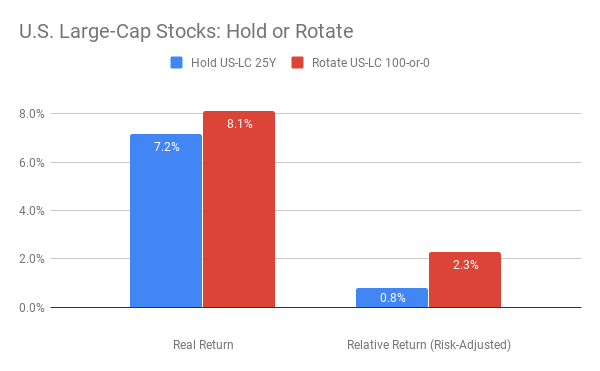
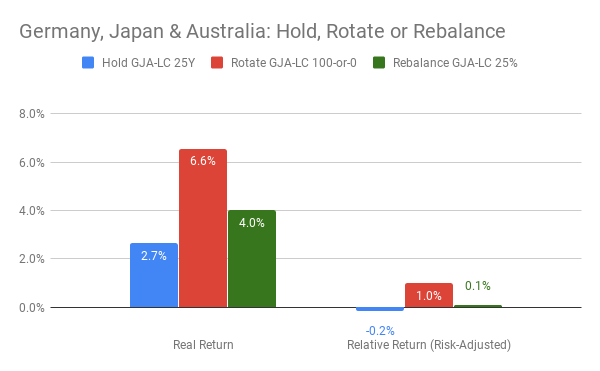
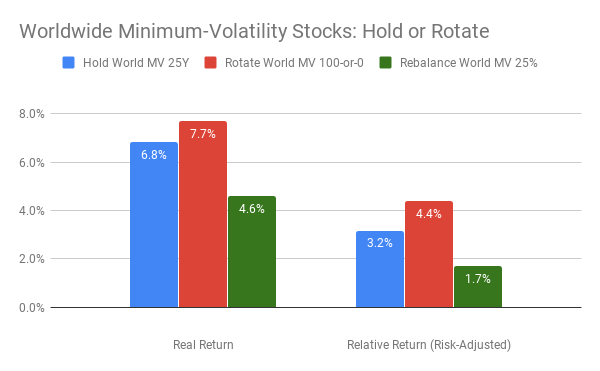
Suppose your primary goal were maximize long-term gains, even at the risk of some turbulence. Then you might find the chart above to be compelling. It shows that, over various 25-year time-periods from 1919 to 2019, spanning a variety of countries and currencies, the strongest returns, adjusted for local inflation, came from rotating between a high ceiling of 100% invested in stocks and a low floor of 0% in stocks. Call it a max-gain strategy of 100-or-0 rotation. Historically, this strategy has managed to sidestep most of the damage of prolonged drawdowns in stock markets, such as happened most recently in 2008-2009. However, it is vulnerable to sudden one-month downturns, such as the October crashes that exceeded 20% in 1929 and 1987, and numerous months with losses approaching 10%, including the recent demise in December 2018.
If one-month losses of that magniture seems a bridge too far, then the goal of your journey as an investor might be a compromise between maximizing gains and minimizing losses. Your preference would be a minimax strategy, as illustrated in the next chart. Taking a different prespective on the same extensive data as the previous chart, this one shows that the best compromise imposes a ceiling of 50% to 60% in stocks and a floor of 0% in stocks. That's a minimax stategy of 60-or-0 rotation. (50-or-0 performs virtually the same.)
If one-month losses of that magniture seems a bridge too far, then the goal of your journey as an investor might be a compromise between maximizing gains and minimizing losses. Your preference would be a minimax strategy, as illustrated in the next chart. Taking a different prespective on the same extensive data as the previous chart, this one shows that the best compromise imposes a ceiling of 50% to 60% in stocks and a floor of 0% in stocks. That's a minimax stategy of 60-or-0 rotation. (50-or-0 performs virtually the same.)
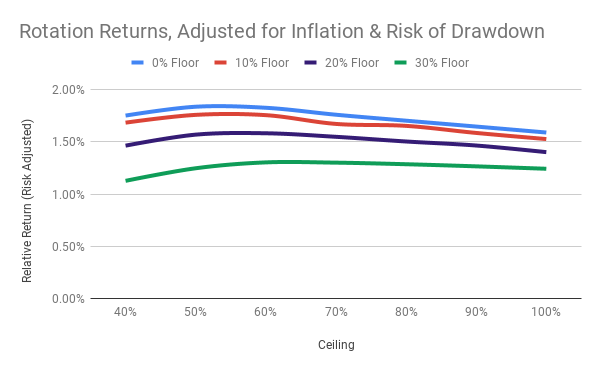
Two risk-controls are at work here. With a ceiling of 60% invested in stocks, your exposure during a sudden 20% downturn is reduced to 12%. Furthermore, with a floor of 0%, you have no exposure to the bulk of a long decline in the stock market, provided that you rotate from stocks to bonds early in the decline.
To map out the routes of these financial journeys, let's examine the two specific portfolios that used rotation to switch from stocks to bonds on June 1 and July 1 this year.
Max-Gain Rotate 100-or-0
This portfolio aims to maximize gains by moving its assets across three basic index funds. The moves occur, on average, about four times per year, possibly with tax consequences if executed in a taxable account. Since 1996, the portfolio has never held the same assets for a full year, though it occasionally came close. At a given time, it is invested entirely in one of three indexed ETFs:
The portfolio's strategy is to review these index ETFs at the end of every month, and invest entirely in the one whose three-month total return is the highest. On June 30, 2019, using the Vanguard ETFs, long-term Treasuries ranked first at 5.71%; U.S. stocks were next at 4.08%; and international stocks were last at 2.80%. Because the portfolio had previously moved all its assets to Treasuries on June 1, 2019, no change was indicated for July.
Historical results for this portfolio can be closely approximated by Vanguard mutual funds whose indexes match the firm's current ETFs. For the 23-year period from July 1, 1996, to June 30, 2019, the hytpothetical performance of the three mutual funds, had it been possible to trade them like ETFs, would have been as shown in the chart below. One line in the chart shows the rotation strategy for Max-Gain Rotate 100-or-0. A second line compares the results of investing equally in the same three funds, 33.3% each, and rebalancing them at the end of the month if the allocation's total drift exceeds 5% (as when a fund in this portfolio went above 38.3% or below 28.3% of the portfolio's total value).
To map out the routes of these financial journeys, let's examine the two specific portfolios that used rotation to switch from stocks to bonds on June 1 and July 1 this year.
Max-Gain Rotate 100-or-0
This portfolio aims to maximize gains by moving its assets across three basic index funds. The moves occur, on average, about four times per year, possibly with tax consequences if executed in a taxable account. Since 1996, the portfolio has never held the same assets for a full year, though it occasionally came close. At a given time, it is invested entirely in one of three indexed ETFs:
- The entire U.S. stock market, via Vanguard Total Stock Market ETF (VTI) or a similar low-cost fund such as iShared ITOT.
- Non-U.S. stock markets as represented by Vanguard Total International Stock ETF (VXUS) or a similar low-cost ETF such as State Street SPDW.
- Long-term U.S. Treasuries with average durations close to 20 years, as represented by Vanguard VGLT or alternatives such as iShares TLT or TLH.
The portfolio's strategy is to review these index ETFs at the end of every month, and invest entirely in the one whose three-month total return is the highest. On June 30, 2019, using the Vanguard ETFs, long-term Treasuries ranked first at 5.71%; U.S. stocks were next at 4.08%; and international stocks were last at 2.80%. Because the portfolio had previously moved all its assets to Treasuries on June 1, 2019, no change was indicated for July.
Historical results for this portfolio can be closely approximated by Vanguard mutual funds whose indexes match the firm's current ETFs. For the 23-year period from July 1, 1996, to June 30, 2019, the hytpothetical performance of the three mutual funds, had it been possible to trade them like ETFs, would have been as shown in the chart below. One line in the chart shows the rotation strategy for Max-Gain Rotate 100-or-0. A second line compares the results of investing equally in the same three funds, 33.3% each, and rebalancing them at the end of the month if the allocation's total drift exceeds 5% (as when a fund in this portfolio went above 38.3% or below 28.3% of the portfolio's total value).
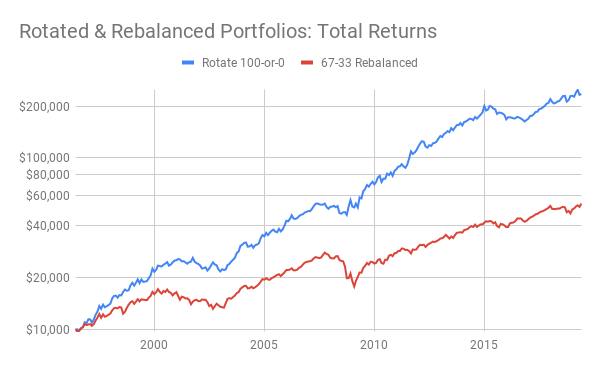
The rotated portfolio was superior to the rebalanced alternative in measurable ways. It had a bigger nominal return (14.7% vs. 7.6%) and a superior risk-adjusted return (7.5% vs. 0.5%). To reap these substantial benefits, however, one had to endure a maximum drawdown that was large (-18.8%). Painful as it might have been, that drawdown was mild compared to the rebalanced portfolio (-36.4%).
Minimax Rotate 60-or-0
To place stronger limits on drawdowns, Minimax Rotate 60-or-0 accepts returns that are less stellar, though still very good. This strategy may be suitable both for taxable accounts and for IRA and 401k savings. On average, the portfolio has had one change per year since 1995, although it had a few of them in some years and occasionally went without a change for two years or longer. At a given time, the portfolio is invested entirely in one of two ways:
The portfolio's strategy is to review the performance of these two funds bimonthly (at the end of even-numbered months) and invest in the one whose total return is better over the previous 12 months. The bimonthly schedule reduces the portfolio's churn and honors the one-month limit that investment firms typically place on selling and repurchasing the same mutual fund. On June 30, 2019, the 12-month total return was better for the bond fund (VBILX, 9.99%) than for the balanced fund (VBIAX, 8.91%). A month earlier, the opposite was true. Hence the portfolio moved all its assets to the bond fund on July 1, 2019, to be left there for at least two months.
Minimax Rotate 60-or-0
To place stronger limits on drawdowns, Minimax Rotate 60-or-0 accepts returns that are less stellar, though still very good. This strategy may be suitable both for taxable accounts and for IRA and 401k savings. On average, the portfolio has had one change per year since 1995, although it had a few of them in some years and occasionally went without a change for two years or longer. At a given time, the portfolio is invested entirely in one of two ways:
- A mutual fund that holds 60% U.S. stocks and 40% U.S. bonds, such as Vanguard Balanced Index Admiral Shares (VBIAX) or equivalent all-U.S. funds.
- A broad mix of 5-to-10 year U.S. corporate and Treasury bonds, such as Vanguard Intermediate-Term Bond Index Admiral (VBILX) or the equivalent.
The portfolio's strategy is to review the performance of these two funds bimonthly (at the end of even-numbered months) and invest in the one whose total return is better over the previous 12 months. The bimonthly schedule reduces the portfolio's churn and honors the one-month limit that investment firms typically place on selling and repurchasing the same mutual fund. On June 30, 2019, the 12-month total return was better for the bond fund (VBILX, 9.99%) than for the balanced fund (VBIAX, 8.91%). A month earlier, the opposite was true. Hence the portfolio moved all its assets to the bond fund on July 1, 2019, to be left there for at least two months.
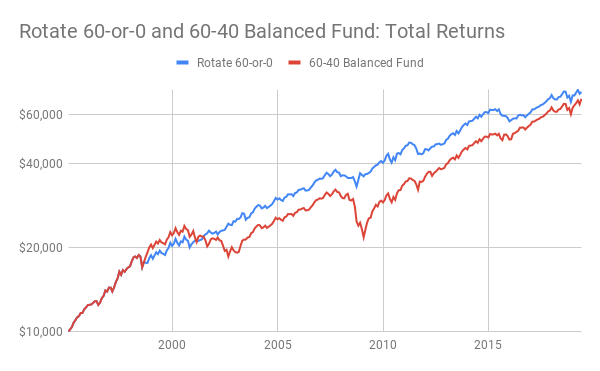
The chart above shows results based on the longest available history of the two Vanguard mutual funds (VBIAX and VBILX) from March 1, 1995, to June 30, 2019. The rotation strategy successfully side-stepped long declines during the dot-com collapse of 2000-2003 and the severe recession of 2008-2009. The traditional 60-40 index fund did not. Consequently, the biggest drawdown of the Minimax Rotate 60-or-0 portfolio was much smaller (-13.0%) than that of Vanguard's 60-40 fund (-32.6%). And recall that the max-gain strategy had a drawdown of -18.8% for the same period.
Yet, as the chart shows, the minimax strategy also met its other objective of generating decent returns. Though less amazing than the max-gain portfolio, minimax rotation did somewhat better than traditional 60-40 rebalancing (8.5% vs. 8.2% in nominal returns). In short, when compared to other alternatives, minimax rotation did indeed produce commendable gains at a notably lower cost in drawdowns and churn.
Some Technical Details
To understand the measurements and data underlying the charts and analysis in this post, see my posts last month, especially Best Options to Minimize Drawdowns and Floors and Ceilings, Part 2.

 RSS Feed