Able to Pay
  • News
  • Retirement
    • Retired Now
    • Retiring Soon
    • Saving to Retire
  • Goals
    • Ask Yourself
    • Building Wealth
    • Investing to Buy
  • Investing
    • Basic Methods
    • Rebalancing
    • Stocks or Bonds?
    • Investment Fees
    • Being Tax-Wise
    • Finding Advice
  • Portfolios
    • Basic Portfolios
    • How Long?
    • Diversify!
    • Factor Investing
    • Finding Value
  • Calculators
    • Best-Invest
    • Safe Payout
  • About

Rebalance or Rotate? The U.S. Since 1919

6/10/2019

1 Comment

 
Historically, you would have gotten good returns by simply holding a target percentage of your portfolio in stocks over many years, keeping the rest in 10-year bonds, and rebalancing periodically if the percentages drifted from your target. However, you would have suffered many drawdowns, sometimes extreme, lasting months or years. A week ago, I gave some examples as part of a series that started with my June 3 post for current U.S. markets, What Now: Sell, Rebalance, or Rotate? 

This week's posts will introduce rotation as an an altenative to rebalancing. Today's examples are for U.S. stock and bond markets dating back to 1919. Four investment strategies are applied to this 100-year period:
  • 100% in the S&P 500, with dividends reinvested.
  • 100% in 10-year Treasury bonds with interest reinvested.
  • 60% in the S&P 500 and 40% in 10-year Treasuries. At the end of each month, either reinvest the income in its source or, if the percentage in stocks has drifted to 55% or 65%, then rebalance stocks and bonds to their respective targets.
  • Either 100% in the S&P 500 or 100% in 10-year Treasuries, according to their recent performance, checked at the end of each month.
Comparing the strategies over the 100-year period from April 1919 to March 2019, 60-40 rebalancing and 100-or-0 rotation were virtually identical in one key way: over the long term, their equity exposures were virtually the same, 60.9% for rebalancing and 60.6% for rotation. In both cases, the portfolio tended to drift more toward stocks than toward bonds. For rebalancing, the long-term exposure to stocks was therefore slightly above the target of 60%. For rotation, the similar outcome over the full 100 years is an interesting coincidence. However, over shorter 25-year intervals, the stock-exposure of 100-or-0 rotation was variable.
Picture
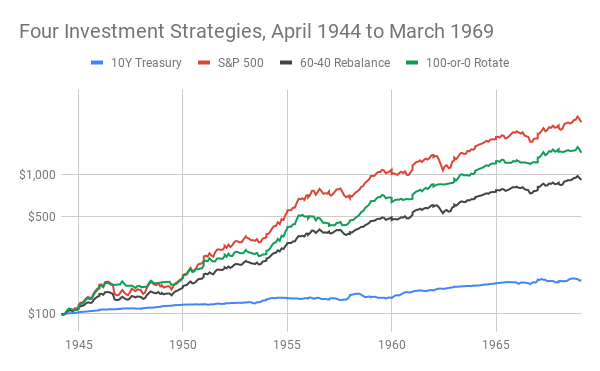
Between 1944 and 1969 (depicted above), 100-or-0 rotation was 69% in stocks, on average. That happened because during these years, stocks strongly outperformed bonds. (See this earlier post for some possible reasons.) Then, continuously holding 100% in the S&P 500 would have been the best strategy; rotation often avoided bonds and thus out-performed rebalancing; and Treasuries were exceptionally weak, actually falling behind the inflation rate.

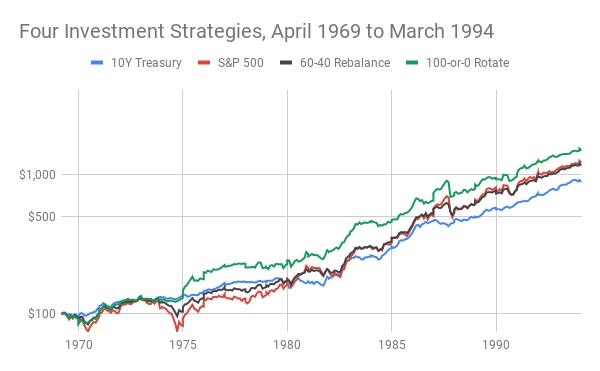
The next 25 years told a different story, as illustrated below. A sharp recession in the mid-1970's, followed by high inflation and high interest rates, then by prolonged rate cuts, combined overall to make the total return of bonds competitive with stock-returns. The strategy of 100-or-0 rotation responded in kind, allocating even-handedly, with an average stock-exposure of 53%. For the full 25 years, rotation beat all the other strategies, not by putting all its eggs in one basket, or by juggling two baskets at all times, but by opting periodically for the basket that better suited the changing financial environment.
Picture
The four 25-year periods since 1919 exhibited a variety of environments, including the two described above; the bull market of the 1920's and Great Depression of the 1930's; and the dot-com bubble, Great Recession, and recent bull market of the 21st century. Across it all, if given 25 years, a strategy of 100-or-0 Rotation ...
  • Beat 60-40 Rebalancing, every time
  • Beat 100% invested in the S&P 500, three of four times
  • Beat 100% placed in 10-year Treasuries, every time
  • Beat inflation handily, for every 25-year period

In forthcoming posts, I'll continue this introduction to rotation as an investment strategy, examining questions like these:
  • Using both raw returns and risk-adjusted metrics, how did rotation fare across 25-year periods and across countries?
  • What about drawdowns, as in "flash-crashes" and major recessions? Did rotation handle them better than rebalancing?
  • Is 100-or-0 the best way to do rotation, at all times and for all investors? Or would less drastic exchanges be better, depending on circumstances?
Finally, regarding how, exactly, to implement a rotation strategy, I will get there in due course. The main idea is pretty simple: check monthly and pick the better of two investments, stocks or bonds. I'll save the specifics until more of the details and nuances have been explained.
1 Comment

Rebalancing the U.S. S&P 500, 1944-1969

6/6/2019

1 Comment

 
Suppose from 1944 to 1969, you held and rebalanced a portfolio matching the S&P 500 index and 10-year U.S. Treasury bonds. Would that have been the optimal investment strategy for those 25 years? This post answers the question, using data similar to posts earlier this week on recent 25-year periods for the Nikkei 225 in Japan and the Dax 30 in Germany. It's all part of a series that follows up my June 3 post about current U.S. markets, What Now: Sell, Rebalance, or Rotate? 
Picture
Comparing this chart to the previous ones for Japan and Germany, one difference stands out. Stocks were indisputably the superior investment. The worst drawdown in the total return of the S&P 500 from April 1944 through March 1969 was -22.3%. In the usual parlance, that's merely a "correction," not a "crash." In the worst single month, had you held all your money in stocks, your loss on paper would have been -14.4%. Those drawdowns, admittedly not small enough to match Treasury bonds, were far less painful than the maximums exceeding -65% and the monthly values around -25% for stock-portfolios in Japan and Germany from 1994 to 2019.

Remarkably, the cumulative real return of an all-stocks portfolio in the U.S., from 1944 to 1969, was 10.4% per year. After inflation! Incredible. The real buying power of your dollars would have grown 11-fold in 25 years. Of course, you had to be there. You had to be alive  then with money to invest. And you had to be smart enough or lucky enough to place all your chips on stocks, at a time when the world war was not yet over, the G.I. Bill not yet conceived, the baby-boom not begun, interstate highways unknown, air-travel restricted to the wealthy, and rationing of necessities the norm. Maybe you would have foreseen that there was nowhere to go but up.

Or maybe the habits of rationing food and buying war-bonds would have inclined you toward the perceived safety of Treasuries. What a mistake that would have been! Over the next 25 years, your real returns would have gone negative. Treasury bonds, in that period, were anything but safe. Cumulatively, they suffered a -16% loss in buying power, as their -0.7% real rate of return compounded. No single month announced this loss. The worst one was merely -2.4%. Japan's and Germany's more recent government bonds had monthly drawdowns twice that amount, but they also had more numerous months of positive, inflation-adjusted returns that generated real gains in the long run.

​The quarter-century from 1944 to 1969 was, coincidentally, when the Bretton Woods Agreement governed global currencies. It made the dollar dominant, governing world markets, for better or worse, by the force of U.S. ownership of the majority of the world's gold. Interest rates in the U.S. were capped for many years early in that period, for fear of post-war deflation, when the reality was an inflationary spike in prices. Then, when interest rates were belatedly allowed to rise, they did so slowly but inexorably for the rest of the period, causing bond prices to fall, also slowly and inexorably. Perhaps misguided monetary governance like this will never happen again. Or maybe not this pattern in particular, but another one crafted in a future time of uncertainty, with similar unforeseen and unhappy consequences. We won't know until, if, and after it may happen.

In the final analysis, the U.S. experience from 1944 to 1969 conveys the same lesson as did the German and Japanese results for 1994-2019. Had a post-war investor in the U.S. opted for the compromise of investing half in stocks and half in Treasuries, rebalancing them monthly to 50-50, if needed, when they drifted to 45-55, then the outcome after 25 years would have been quite satisfactory. In round numbers, the maximum drawdown would have been a tolerable -10%; the worst month, only -8%; and the annualized real return, a handsome 5%.

Summing up the three cases, we have one (Japan, recently) where going all-in on bonds was best; another (the U.S., a half-century earlier) where that would have been a disaster; and two where stocks were best, once by a small amount (Germany, recently) and once by a huge margin (the post-war U.S. again). A rebalancing strategy was never best nor worst, yet all three times it beat inflation. The rub, however, is that rebalancing only partly managed the problem of severe drawdowns.

Next week, posts in this series will continue with a fresh look at a different strategy, rotation, to examine whether it can succeed when rebalancing comes up short.
1 Comment
<<Previous
Forward>>

    AC Wilkinson

    Enabling you to pay for your financial goals, and helping non-profits to thrive. Read more.

    Picture

    RSS Feed


    ​Categories

    All
    Fees
    Firms
    Inflation
    Investing
    Planning
    Retirement

(c) Able to Pay, LLC 2014-2020. All rights reserved.

Site Map

Legal

Contact

News
Retirement
   Retired Now
   Retiring Soon
   Saving to Retire
Goals
Investing
Portfolios
Calculators
    Best-Invest
    Safe Payout
    Retiree Reserves
About


Fiduciary Oath
Terms and Conditions of Use
Privacy Policy
Disclosures

contact@able2pay.com
Able to Pay, LLC
New York, NY

Proudly powered by Weebly
Photos used under Creative Commons from blhphotography, daveynin, Markus Trienke, rust.bucket, Seth W., Brett Jordan
  • News
  • Retirement
    • Retired Now
    • Retiring Soon
    • Saving to Retire
  • Goals
    • Ask Yourself
    • Building Wealth
    • Investing to Buy
  • Investing
    • Basic Methods
    • Rebalancing
    • Stocks or Bonds?
    • Investment Fees
    • Being Tax-Wise
    • Finding Advice
  • Portfolios
    • Basic Portfolios
    • How Long?
    • Diversify!
    • Factor Investing
    • Finding Value
  • Calculators
    • Best-Invest
    • Safe Payout
  • About