
Yesterday's post showed how four investment strategies handled two consecutive 25-year periods between 1944 and 1994, for stocks and bonds in the U.S. Today I'll examine the same strategies over two additional 25-year periods, bookending the previous ones and thus spanning a full century. The first period, 1919 to 1944, had the Great Depression; the second, 1994 to 2019, had the dot-com crash and the Great Recession. Truly, those were stress-tests for any portfolio.
The two charts below capture the main points of interest. (Or, to follow the story-line from the beginning, go back to my June 3 post, What Now: Sell, Rebalance, or Rotate?)
The two charts below capture the main points of interest. (Or, to follow the story-line from the beginning, go back to my June 3 post, What Now: Sell, Rebalance, or Rotate?)
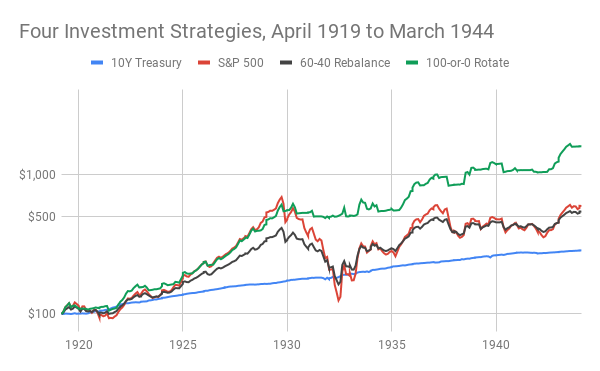
Had you held the S&P 500 (or something similar) throughout the bull market of the 1920's, the dreadful 1930's, and much of World War II, you would have suffered two big drawdowns. The killer, exceeding -80%, took three excruciating years from 1929 to 1932. Another, in 1937, was swifter and, at -41%, must have felt almost as frightful. Look, too, at 60-40 rebalancing! It offered no shelter, hugging the all-stocks portfolio as if in numbed desperation.
Treasury bonds, by comparison, gave an astoundingly smooth ride, perhaps because the bond-market was less mature than it is now or, more likely, because the U.S. Treasury controlled interest rates in a much different manner than the Federal Reserve has done since the 1950's. Yet, as good as the all-Treasury portfolio might have been, it was easily surpassed by 100-or-0 Rotation, a strategy that went all-in on stocks when their recent trend was better than 10-year Treasuries, and all-in on those same Treasuries when they had lately been the better of the two options. In this analysis, "lately" means, very simply, not last month, but the last several.
Treasury bonds, by comparison, gave an astoundingly smooth ride, perhaps because the bond-market was less mature than it is now or, more likely, because the U.S. Treasury controlled interest rates in a much different manner than the Federal Reserve has done since the 1950's. Yet, as good as the all-Treasury portfolio might have been, it was easily surpassed by 100-or-0 Rotation, a strategy that went all-in on stocks when their recent trend was better than 10-year Treasuries, and all-in on those same Treasuries when they had lately been the better of the two options. In this analysis, "lately" means, very simply, not last month, but the last several.
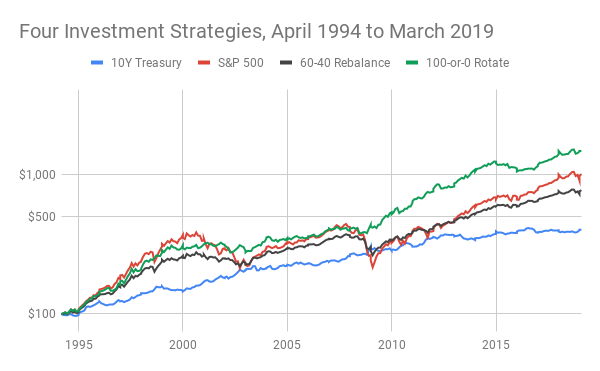
A half-century later, remarkably similar patterns began to emerge, like old music found in tattered manuscripts and replayed on new instruments. From 1994 to 2009, stocks had a bull market whose brassy boasting was soon silenced by a da capo of drawdowns. For its part, a 60-40 rebalanced porfolio held close to the rhythm of stocks. Treasuries made steady progress, while moving to a subdued drumbeat. Once again, a portfolio of 100-or-0 Rotation avoided firm commitments and, charmingly fickle, danced with each month's better partner. Doing so, it largely side-stepped the worst moments and outdid all others.
Taken together, the four 25-year periods shown in today's and yesterday's posts constitute a statistical sample. Averaging measurements across the four intervals generates an estimate of the outcomes one might expect in future quarter-centuries. For example, an average of the four maximum drawdowns will estimate the expected maximum drawdown in any future 25-year period.
Estimating in this way is more useful than simply calculating the maximum drawdown over the past 100 years. You and I won't be investing for 100 years. The expectation for any 25-years, based on an admittedly small sample of four, is statistically more reliable and pragmatically more relevant than an expectation for 100 years, based on an even smaller sample of one.
Accordingly, the summary chart below shows several expected outcomes for future quarter-centuries. It also compares expectations across the four investment strategies.
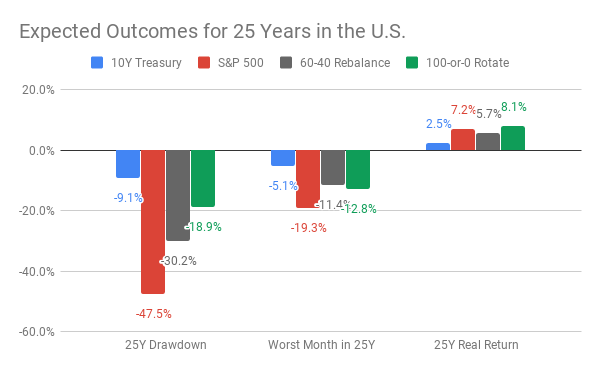
Were you to invest entirely in the S&P 500 over the next 25 years, you should brace for a drawdown of about -48% at some point, plus a bad month with a paper loss of -19%, as you march toward an eventual inflation-adjusted annual return of 7%. In short: nice gains, big pains. Investing entirely in 10-year Treasuries would likely have much smaller drawdowns of -9% at the low point and -5% in the worst month, but your gains would be correspondingly reduced to about 2% or 3% more than inflation. A typical plan of 60-40 Rebalancing would reduce the pain of drawdowns, compared to the S&P 500, while also sacrificing some gains. Best of all, however, would be 10-or-0 Rotation, which could be expected to generate better gains than the S&P 500 and smaller drawdowns.
My next post will apply the same four portfolios to countries outside the U.S., for the most recent 25-year period.
My next post will apply the same four portfolios to countries outside the U.S., for the most recent 25-year period.

 RSS Feed