This post is part of a series on building a portfolio of mutual funds or Exchange Traded Funds. The topics of the series, listed below, have been expanded into a downloadable handbook at Enable!, our online bookstore. The download includes new content on account types, sample portfolios, technical methods, and more.
- Start with Basics: Some simple ideas that work remarkably well.
- Diversify Smartly: Effective ways to diversify with bonds and stocks, globally.
- Focus on Factors: Specialized portfolios that employ techniques from academic research.
- Respond to Inflation: Realistic options for inflation-protection, near-term and long-term.
Bonds may seem simple. But they aren’t. To explain how they might diversify a portfolio, I’ll start with a common-sense overview, then give some basic recommendations for U.S. bonds. After that, if you want details and justifications, you can optionally read to the end of this post. International bonds are covered in a separate post.
Why Bonds Are Hard
You buy bonds, they pay interest until they mature, then you get your original deposit back. Almost like CDs, right?
Well, not exactly. With bonds, the price goes up or down as the prevailing interest rates go down or up. It’s backwards. Rising interest rates mean falling values for the bonds in your portfolio, and vice versa.
Plus this. With bonds, unlike CDs, you have to worry whether the bond-issuer will default, stop paying the interest you are due, and maybe return less than your original purchase amount. Treasury bonds, issued by the U.S. government, are the least likely to default, hence the safest. Corporate bonds have a higher risk of default, particularly from low-rated companies.
Foreign bonds, anyone? If they are issued by, say, the United Kingdom or Japan, the risk of default is probably very low. But there’s a catch. You have to buy the bonds in British pounds or Japanese yen and convert the interest-payments to dollars. You have become a currency gambler.
Then there’s inflation. If it goes up (or down), interest rates will tend to rise (or fall), but not immediately, and your bond values go the other way (eventually). What’s more, there’s presumed inflation, the rise or fall that bond-investors expect to occur. This expectation affects bond-prices, too. And guess what? The expectations may be wrong (because inflation is hard to predict). Even if the expectation is right, and inflation perks up as forecasted, long-term interest rates are likely to respond later and less than short-term ones. All of which makes bond-pricing and inflation-watching a real puzzler.
Try to figure this one out: You thought inflation rates would rise, followed in a few months by rising interest rates, after which the U.S. economy would slow down to what economists once called a “soft landing,” and a mild recession would then grip the globe. As events unfolded, interest rates did rise, but inflation failed to follow, and every economy worldwide tanked more than forecasted, causing some indebted companies and weak governments to default. What happened to your bond portfolio?
Give up? Some investment firms do essentially that, opting for the easy recommendation to buy a portfolio that covers the “total bond market.” Examples: VBMFX plus VTIBX from Vanguard; or AGG plus IGOV from iShares; or ETF combinations weighted to mimic the world’s bond markets, as done at Betterment, Schwab, and others. (Actually, these are “near-total” funds as they rightly exclude junk-bonds from low-rated companies and tax-advantaged bonds from city and state government.)
Basic Recommendations
The following recommendations are based on academic research as reviewed in a fine textbook by Andrew Ang, and on my own detailed analysis of U.S. Treasury and corporate bonds from 1953 to 2015. This historical period had three very different, 20-year phases. The first saw rising interest rates; the second had high inflation coupled with rates that rose then started to fall; and the last enjoyed steadily falling rates. Beware of advice based exclusively on any newer, shorter time period. Most questionable are recommendations from data that starts after 1982. That's an exuberant period of falling interest rates, rising bond prices, and low inflation overall, which was biased in favor of bonds.
My analysis of the longer period from 1953 to 2015 suggests that three bond funds can diversify your stock investments. At any given time, one or two of them will suffice, depending on your circumstances.
To determine which fund to use, if you plan to hold your investments for five years or longer, consult the table below. For example, when Able to Pay's calculator (or some other method) says you should invest 70% in stocks, then the table advises you to put the remaining 30% in long-term government bonds. But if your stock-allocation is below 40%, the table assigns the rest to long-term corporates. The 40% threshold is not absolute. You could reasonably use an even split of long-term government and corporate bonds for stock-allocations near 40%.
My analysis of the longer period from 1953 to 2015 suggests that three bond funds can diversify your stock investments. At any given time, one or two of them will suffice, depending on your circumstances.
- Long -Term U.S. Government. The fund should invest in bonds from the U.S. Treasury and other federal agencies, with average maturities longer than 10 years, preferably near 20. Examples: VUSTX or VGLT from Vanguard, or TLH or TLT from iShares.
- Long-Term Corporate. The fund should hold 10-to-30 year bonds issued by well-rated (investment-grade) U.S. companies. Examples: VWESX or VCLT from Vanguard, or LQD from i-Shares.
- Short-Term U.S. Government. In this fund you should find Treasuries and bonds from other federal agencies, with average maturities of 2 to 3 years. Examples: VSGBX, VGSH, or VFISX from Vanguard, or SHV from iShares.
To determine which fund to use, if you plan to hold your investments for five years or longer, consult the table below. For example, when Able to Pay's calculator (or some other method) says you should invest 70% in stocks, then the table advises you to put the remaining 30% in long-term government bonds. But if your stock-allocation is below 40%, the table assigns the rest to long-term corporates. The 40% threshold is not absolute. You could reasonably use an even split of long-term government and corporate bonds for stock-allocations near 40%.
| Holding Periods Longer Than 5 Years | ||
|---|---|---|
| Stocks | 20 Year Governments | 20 Year Corporates |
| 90% | 10% | -- |
| 80% | 20% | -- |
| 70% | 30% | -- |
| 60% | 40% | -- |
| 50% | 50% | -- |
| 40% | 60% | -- |
| 30% | -- | 70% |
| 20% | -- | 80% |
| 10% | -- | 90% |
For holding periods of one to five years, two changes should occur. Your stock-allocation should decrease, to reduce the risk of loss. Concurrently, your bond-holdings should shift toward short-term government issues, both to control losses and to respond, if necessary, to inflation.
The next table lays out guidelines for a forward-looking, middle-of-the-road investor, one who aims both to achieve some gains and to limit possible losses, and who plans to spend 100% of her savings one to five years from now. Consistent with the preceding table, long-term bonds are allocated to corporates if the overall stock-allocation is under 40%; otherwise, the long-term portion goes to government-issued bonds. One could do about equally well by putting bonds in an intermediate-term index, such as a "total bond market" fund, when the stock percentage is below 40% and the holding period is five years or less.
| Example for Holding Periods from 1 to 5 Years | |||
|---|---|---|---|
| Years Left | Stocks | 20 Year Bonds | 2-3 Year Bonds |
| 5 | 51% | 39% (Government) | 10% (Government) |
| 4 | 46% | 35% (Government) | 19% (Government) |
| 3 | 37% | 33% ( Corporate ) | 30% (Government) |
| 2 | 26% | 31% ( Corporate ) | 43% (Government) |
| 1 | 10% | 30% ( Corporate ) | 60% (Government) |
For values fine-tuned to your preferences and circumstances, use Able to Pay’s calculators, which take into account two aspects of your holding period: when you will start spending, and how many years you will continue spending. The best allocations for you may be different from the tables above if your spending starts farther in the future or lasts more than five years. And bear in mind that any funds you need to spend within 12 months (a zero-year holding period) should be kept in bank savings, T-Bills, or a money-market fund.
These are the basic recommendations. To get the full details, read on!
Whether to Diversify
To develop recommendations for corporate and long-term bonds, I began by asking whether various bonds could beneficially diversify a portfolio that already held U.S. stocks. This analysis entailed a new concept, investment factors. Where macro-factors apply to big forces that affect an entire economy or many markets, an investment factor is more narrow. It affects the investments in a particular market.
Academic research has identified several investment factors affecting bonds. The two most important, for our purposes, are term structure and credit risk.
Academic research has identified several investment factors affecting bonds. The two most important, for our purposes, are term structure and credit risk.
- Term refers to the number of years a bond pays interest (its years to maturity). Short-term bonds have maturities less than 5 years; intermediate-term bonds, 5-10 years; long-term bonds, 10-30 years. As Ang’s book explains (chapter 9, section 3.3), the interest rates of short-term bonds are heavily influenced (about 70%) by inflation; they are much less influenced by economic growth, monetary policies, and other macro-factors. For long-term bonds, the opposite holds true. They are weakly influenced by inflation (32%) and strongly influenced by other factors. The influences on intermediate-term bonds are much like those for long-term bonds. It may be promising, therefore, to diversify between short-term and long-term bonds, omitting or de-emphasizing the intermediate term.
- Credit refers to the risk of default. Will the issuer of the bond make good on the promise to pay dividends and to return all the principal (the face value) when the bond matures? With U.S. Treasuries, the risk of default is extremely low, and is often assumed to be zero. In contrast, bonds issued by corporations (and government agencies other than the U.S. Treasury) have some risk of default. Investors who held bonds from General Motors in 2009, for example, or from the City of Detroit a few years later, faced the very real risk of not being repaid the full amount they had invested. Credit risk can be mitigated by buying bonds from many issuers, just as the risk of bankruptcy can be mitigated for stocks by purchasing shares in many companies. Because corporate bonds have credit risk and U.S. Treasuries do not, diversifying across the pair of them may be advantageous.
- Are they objectively different? When contrasted with stocks, corporate bonds depend on the financial health of the companies, as stocks do. Treasuries don’t. They depend, instead, on the good faith and credit of the U.S. government. Thus, Treasuries should get more weight as diversifiers, because they differ from stocks to a greater extent than corporate bonds do. Among bonds, the biggest differences are between short-term Treasuries and long-term corporates, as they differ on both factors. Perhaps these two will diversify each other, while they also diversify stocks.
- Are there new risks? Technically, the credit risk of a company’s bonds is somewhat less than the risk of loss from investing in the same company’s stock. Why? Because if the company fails, bond-holders may partially recoup their investments, while stock-holders lose everything. Because of this, and because the default-risk of U.S. Treasuries is extremely low, the incremental risk of adding any bonds to a portfolio is minimal. That’s good for diversification! (A caveat: Low-rated bonds, which have high credit-risk, may add little value.)
- Are the returns equal or better? No. In general, the returns on bonds are less than on stocks. However, long-term bonds come closest to the compound return of stocks, thus arguing for them as the best of a set of tepid choices.
- What’s the correlation? Historically, the correlation between Treasuries and stocks has tended to be zero or somewhat negative, making Treasuries attractive diversifiers for a stock-portfolio. Corporate bonds tend to have low positive correlations with stocks, low enough to make them candidates for diversification, but less compelling than Treasuries.
- 2 Year Treasuries (short-term)
- 5 Year Treasuries (intermediate-term)
- 10 Year Treasuries (intermediate-term)
- 20 Year Treasuries (long-term)
- 20-30 Year A-Rated Corporates (long-term, with favorable credit-risk)
- Simulated Intermediate-Term Index*
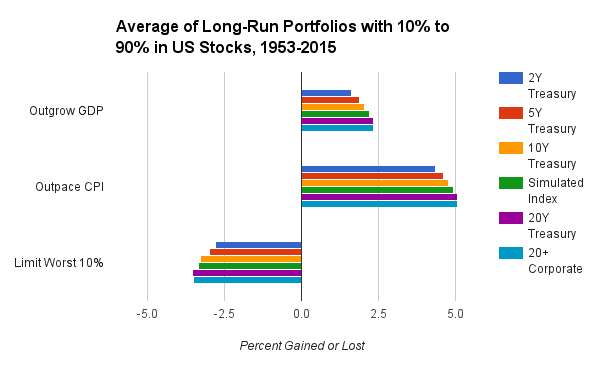
The chart above shows the results, applying the same investment goals used earlier in this series. For building real wealth and keeping pace with inflation, long-term bonds, both Treasuries and corporates, best diversified a portfolio that already had stocks. They generated the biggest portfolio returns. For limiting downside volatility, however, 2-year Treasuries were the best addition, because they had the smallest portfolio losses. In comparison, intermediate 5- and 10-year Treasuries and a simulated intermediate-term index were middling, neither best nor worst.
This finding poses a dilemma. Is it possible to add both long-term bonds and short-term Treasuries without nullifying their respective benefits? Or does one cancel the other, making the combination no more effective than simply using intermediate-term bonds, perhaps chosen broadly to represent the entire bond market? The solution to the dilemma turns on your goals as an investor.
This finding poses a dilemma. Is it possible to add both long-term bonds and short-term Treasuries without nullifying their respective benefits? Or does one cancel the other, making the combination no more effective than simply using intermediate-term bonds, perhaps chosen broadly to represent the entire bond market? The solution to the dilemma turns on your goals as an investor.
How to Diversify
Long-Run Goals
Continuing with the same broad goals used earlier in this series, let’s first consider investments you plan to hold longer than five years. For these, your weights would be:
Continuing with the same broad goals used earlier in this series, let’s first consider investments you plan to hold longer than five years. For these, your weights would be:
- Grow wealth: High
- Protect buying power: High
- Avoid losses, near-term: Low
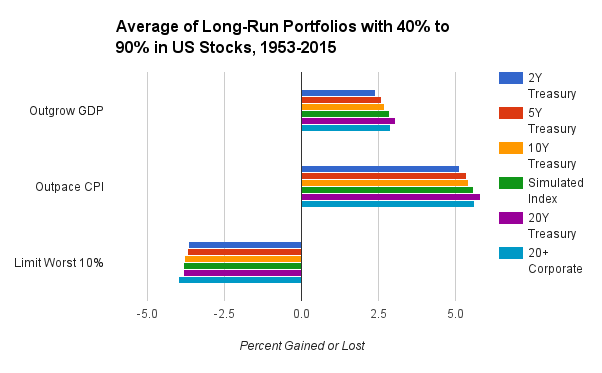
The evidence is in the chart above. It is like the previous chart, but limited to portfolios with 40% or more invested in stocks.** In the top two panels, which correspond to the high-weighted goals, notice the bump-out for 20-year Treasuries. Even for the lower-weighted goal of limiting near-term losses, in the bottom panel, 20-year Treasuries did virtually as well as most other bonds, for these long-run portfolios.
The advantage of 20-year Treasuries was consistent. They ranked first or a very close second at all stock-allocation levels from 40% to 90%. That said, they were not necessarily tops in any given year, and the paths taken through particular 20-year periods were variable.
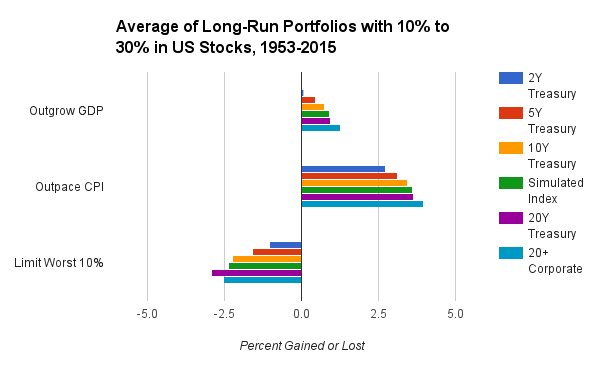
What if you prefer to invest less in stocks for the long run than our models recommend? In that case, at stock allocations from 10% to 30%, long-term corporates would have been your best diversifier, historically. This makes sense intuitively because a smaller allocation to economically sensitive stocks encourages a modest exposure to the credit risk of corporate bonds. The next chart has the evidence. Now the bump-out in the top two panels is for long-term corporates.
Near-Term Goals
Bear in mind that the foregoing results are for holding stocks and long-term bonds for many years. What if you hold them for shorter periods? Then your goals are different, something like this:
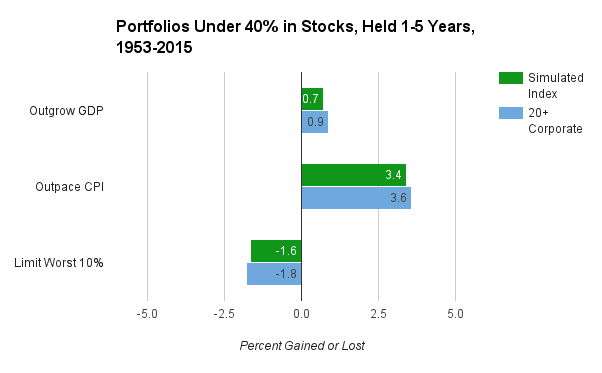
The next chart answers the question with two good options. It displays average results over all of the 20 unique combinations generated by our calculators where the holding period is five years or less and the recommended allocation to stocks is under 40%.
Bear in mind that the foregoing results are for holding stocks and long-term bonds for many years. What if you hold them for shorter periods? Then your goals are different, something like this:
- Grow wealth: Low
- Protect buying power: High
- Avoid losses, near-term: High
The next chart answers the question with two good options. It displays average results over all of the 20 unique combinations generated by our calculators where the holding period is five years or less and the recommended allocation to stocks is under 40%.
Yes, keeping the remainder in long-term corporates is a good option. Virtually as good, however, is assigning the rest to a fund that indexes intermediate-term corporate and government bonds (“total bond market” funds, for example). The real return is slightly worse with the intermediate option, but the risk of loss compensates with a marginally better reading, and this is the more important goal. All in all, both choices work well.
Examples
Long-Run Example
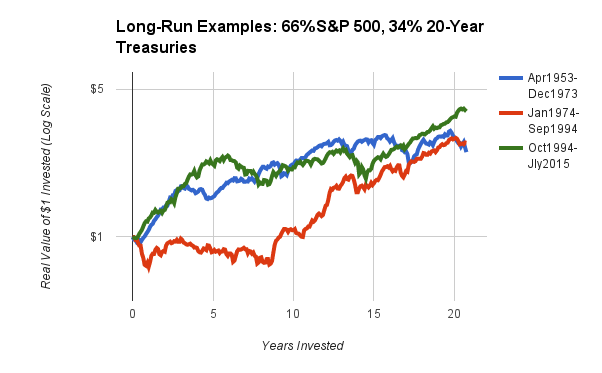
Recall that the historical data covered three 20-year periods during which bonds performed very differently. Using the previous example of a long-run portfolio with 66% in stocks (the S&P 500), the following chart illustrates what happened in each period when the the remaining 34% went to long-term Treasuries. The journeys were disparate, but the outcomes, very similar.
Recall that the historical data covered three 20-year periods during which bonds performed very differently. Using the previous example of a long-run portfolio with 66% in stocks (the S&P 500), the following chart illustrates what happened in each period when the the remaining 34% went to long-term Treasuries. The journeys were disparate, but the outcomes, very similar.
Near-Term Example
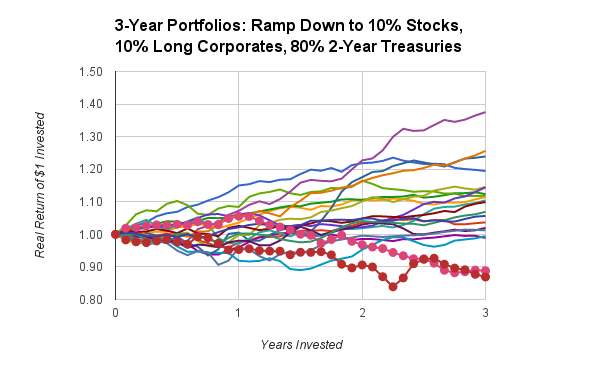
Previously, when looking at basic portfolios, we examined non-overlapping, three-year holding periods for investments cautiously allocated 25% to S&P 500 stocks, 20% to 10-year Treasuries, and 55% to 2-year Treasuries. Let's take a fresh look at those periods, with these updates:
Previously, when looking at basic portfolios, we examined non-overlapping, three-year holding periods for investments cautiously allocated 25% to S&P 500 stocks, 20% to 10-year Treasuries, and 55% to 2-year Treasuries. Let's take a fresh look at those periods, with these updates:
- Long-term corporates replace 10-year Treasuries.
- The investor, using Able to Pay's calculators in the intended manner, updates allocations annually as the years ramp down from three remaining to two and then to one. By the final year, the allocations are 10% S&P 500 stocks, 10% long-term corporates, and 80% 2-year Treasuries.
- Instead of periodic rebalancing, the portfolio is simply set to its new allocations at the end of each year.
* The Simulated Intermediate-Term Index was a weighted average of 10% 2-year Treasuries, 50% 10-year Treasuries, and 40% 20-30 year corporates. This value had virtually the same compound return and standard deviation as Vanguard's Intermediate Bond Index fund since it was initiated in 1994.
** While 40% was chosen as a threshold because of Able to Pay’s model for long-run portfolios (held five years or longer), it was optimal by another criterion, as well. In a linear regression seeking to optimize returns, 40% was the point above which 20-year government bonds emerged as the best long-term diversifiers. Below 40%, long-term corporates were better.
** While 40% was chosen as a threshold because of Able to Pay’s model for long-run portfolios (held five years or longer), it was optimal by another criterion, as well. In a linear regression seeking to optimize returns, 40% was the point above which 20-year government bonds emerged as the best long-term diversifiers. Below 40%, long-term corporates were better.
Data sources: Shiller for S&P500, 10-Year Treasuries, and CPI inflation. FRED for 2-year, 5-year, and 20-year Treasuries, and A-rated long-term corporates; some missing data-points were interpolated with regression models. BEA for real GDP annually in the U.S. For those interested in technical details, a forthcoming article to be published at this site will explain how the measurements here were constructed and compare them to other possible methods of analysis.
Disclaimer: Historical data cannot guarantee future results. Although a mixture of bonds and stocks may be safer than investing exclusively in one class of assets, diversification cannot guarantee a positive return. Losses are always possible with any investment strategy. Nothing here is intended as an endorsement, offer, or solicitation for any particular investment, security, or type of insurance.


 RSS Feed